| Dimension |  |
 |
 |
 |
 |
 |
 |
 |
 |
 |
 |
 |
 |
 |
 |
 |
 |
 |
Dimensions of dyslexia - correlation inter-relationships
These are the 18 dimensions selected for the enquiry listed in the order in which they appear in the QNR
'In your interactions with students with dyslexia, to what extent do you encounter each of these dimensions?'
1. students' spelling is generally poor
2. students say that they find it challenging to manage their time effectively
3. students say that they can explain things more easily verbally than in their writing
4. students show evidence of being very disorganized most of the time
5. in their writing, students say that they often use the wrong word for their intended meaning
6. students seldom remember appointments and/or rarely arrive for them on time
7. students say that when reading, they sometimes re-read the same line or miss out a line altogether
8. students show evidence of having difficulty putting their writing ideas into a sensible order
9. students show evidence of a preference for mindmaps or diagrams rather than making lists or bullet points when planning their work
10. students show evidence of poor short-term (and/or working) memory - for example: remembering telephone numbers
11. students say that they find following directions to get to places challenging or confusing
12. when scoping out projects or planning their work, students express preference for looking at the 'big picture' rather than focusing on details
13. students show evidence of creative or innovative problem-solving capabilities
14. students report difficulties making sense of lists of instructions
15. students report regularly getting their 'lefts' and 'rights' mixed up
16. students report their tutors telling them that their essays or assignments are confusing to read
17. students show evidence of difficulties in being systematic when searching for information or learning resources
18. students are very unwilling or show anxiety when asked to read 'out loud'
Correlation coefficients between dimensions:
 The matrix of correlation coefficients shown below presents Pearson Product-Moment r values between all dimensions and illustrates the effect size of interrelationships.
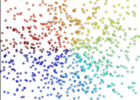
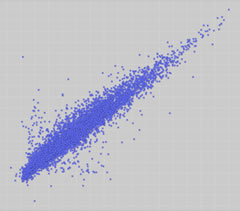
The correlation coefficient displayed in each table cell is also hyperlinked to the respective scatter diagram showing the relationship between the two dimensions graphically. This is useful because it presents the actual data points used in the calculation for the correlation coefficients but the scatter diagram also easily shows whether the datasets contained significant outliers. In all cases, the scatter diagrams were created from the complete datasets without outliers being removed if they occured. In some cases significant outliers did arise and where this occured the outliers were removed to explore the impact that this had on the correlation coeffiecients. Where this was judged to be worth reporting, the adjusted correlation coefficient is included in the lower quadrant of the table with the outlier(s)-removed value asterisked * and the original-data value in parentheses( ). It can be seen that in several cases, removing the outliers has produced a re-calculated correlation coefficient that is substantially different.
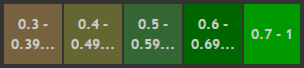 The colour coding of the cells in the table provides an 'at a glance' indication of the level of correlation between the respective pairs of dimensions. There appears to be no definitive criteria for setting correlation level boundaries for indications of strength although 'rule of thumb' guidelines suggest that r > 0.6 indicates a 'strong' positive correlation, values between 0.4-ish to 0.6 suggest moderate strength of association and values between 0.3 (or even 0.2 in some sources) and 0.4 indicating weak correlation between the variables. With this in mind, boundaries for the correlation coefficient, r, set for these datasets are more finely defined so that the data table below is easier to understand:
Discussion
Although at present, the coefficients have been calculated and scatter diagrams plotted to spot outliers and explore the impact that removing them has on r, a deeper investigation about what might be going on is another further development to be undertaken later. Some of the linkages revealed do appear fascinating, for example, there appears to be a moderate positive correlation r = 0.554) between students observed to be poor time-keepers and who also often get their ‘lefts’ and ‘rights’ mixed up; or that students who are reported to be poor at following directions to get to places appear to also be creative problem-solvers (r = 0.771). Although some other inter-relationships are well-observed and unsurprising, for example, r = 0.601 for the dimensions relating to poor working memory and confused writing. These are interesting results and a deeper analysis and discussion will be developed later.