| w | statement | H / L | r | RC ? |
| 0.80 | When I was learning to read at school, I often felt I was slower than others in my class | H | 0.51 | - |
| 0.53 | My spelling is generally very good | L | - 0.52 | RC |
| 0.70 | I find it very challenging to manage my time efficiently | H | 0.13 | - |
| 0.71 | I can explain things to people much more easily verbally than in my writing | H | 0.60 | - |
| 0.57 | I think I am a highly organized learner | L | - 0.08 | - |
| 0.48 | In my writing I frequently use the wrong word for my intended meaning | H | 0.67 | - |
| 0.36 | I generally remember appointments and arrive on time | L | 0.15 | - |
| 0.75 | When I'm reading, I sometimes read the same line again or miss out a line altogether | H | 0.41 | - |
| 0.76 | I have difficulty putting my writing ideas into a sensible order | H | 0.51 | - |
| 0.80 | In my writing at school, I often mixed up similar letters like 'b' and 'd' or 'p' and 'q' | H | 0.61 | - |
| 0.57 | When I'm planning my work I use diagrams or mindmaps rather than lists or bullet points | neutral | 0.49 | - |
| 0.75 | I'm hopeless at remembering things like telephone numbers | H | 0.41 | - |
| 0.52 | I find following directions to get to places quite straightforward | L | -0.04 | - |
| 0.57 | I prefer looking at the 'big picture' rather than focusing on the details | neutral | 0.21 | - |
| 0.63 | My friends say I often think in unusual or creative ways to solve problems | H | 0.20 | - |
| 0.52 | I find it really challenging to make sense of a list of instructions | H | 0.49 | - |
| 0.52 | I get my 'lefts' and 'rights' easily mixed up | H | 0.39 | - |
| 0.70 | My tutors often tell me that my essays or assignments are confusing to read | H | 0.36 | - |
| 0.64 | I get in a muddle when I'm searching for learning resources or information | H | 0.57 | - |
| 0.72 | I get really anxious if I'm asked to read 'out loud' | H | 0.36 | - |
project outline | design | academic confidence | dyslexia index
discourse study-blog | resources | lit review maps | profiles
enquiry research QNR | dysdefs QNR | dysdims QNR
discourse study-blog | resources | lit review maps | profiles
enquiry research QNR | dysdefs QNR | dysdims QNR
 dyslexia index
 Dyslexia Index - designing a self-report profiler that identifies dyslexia-like study attributes in university students
- Introduction
- Dyslexia - a complex phenomenon
- Labels, categories, dilemmas of difference and inclusivityk
- Measuring dyslexia - "how dyslexic am I?"
- Dyslexia Index (Dx)
- Construction of the Dyslexia Index (Dx) Profiler
- Feeding these results into the construction of the Dx Profiler
- Reverse coding data
- Internal Consistency Reliability - Cronbach's α
- Main research preliminary findings
- Relating Dyslexia Index (Dx) to Academic Behavioural Confidence (ABC)
- Concluding remarks
- References
INTRODUCTION
This paper presents detail of the design and development of the Dyslexia Index Profiler which featured as an integral part of the main research questionnaire for this project, recently deployed to university students to collect primary data for addressing the project's research questions.
Some theoretical perspectives about dyslexia and about issues of accommodating individual learning differences in university contexts form the opening sections. This is followed by a detailed description of the design and development of the Dyslexia Index Profiler, the background research that has been undertaken to try to bring a fresh perspective on the difficult issue of identifying dyslexia amongst university students which includes a report of two early-stage, small-scale enquiries undertaken to inform that design and development.
Following this, a report on the statistical processes that have been utilized to attempt to validate the profiler is presented, which includes a brief review of the literature relating to issues surrounding Likert scale questionnaire design. The paper concludes with an outline of the immediate plans for the continuation of the overall research project together with an indication about how the Dyslexia Index Profiler has already been modified in the light of the data analysis.
DYSLEXIA - A COMPLEX PHENOMENON
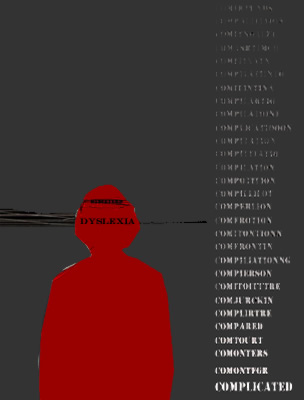 Dyslexia - whatever it is - is complicated.
There is a persistent range of research methodologies and a compounding variety of interpretations that seek to explain dyslexia which continue to be problematic (Rice & Brooks, 2004) and so attributing any accurate, shared meaning to the dyslexic label that is helpful rather than confusing is challenging.
Theories of developmental dyslexia differ quite widely, especially when it comes down to interpreting causes for the variety of characteristics that can be presented (Ramus, 2004). Well over a century of research, postulation, commentary, narrative and theory has consistently failed to arrive at an end-point definition to the dyslexia label (Smythe, 2011), and as long as positive learning outcomes based on high levels of literacy remain connected to 'intellect' (MacDonald, 2009), learning barriers attributable to even a social construction of dyslexia are likely to remain, no matter how the syndrome is defined (Cameron & Billington, 2015).
Dyslexia - whatever it is - is complicated.
There is a persistent range of research methodologies and a compounding variety of interpretations that seek to explain dyslexia which continue to be problematic (Rice & Brooks, 2004) and so attributing any accurate, shared meaning to the dyslexic label that is helpful rather than confusing is challenging.
Theories of developmental dyslexia differ quite widely, especially when it comes down to interpreting causes for the variety of characteristics that can be presented (Ramus, 2004). Well over a century of research, postulation, commentary, narrative and theory has consistently failed to arrive at an end-point definition to the dyslexia label (Smythe, 2011), and as long as positive learning outcomes based on high levels of literacy remain connected to 'intellect' (MacDonald, 2009), learning barriers attributable to even a social construction of dyslexia are likely to remain, no matter how the syndrome is defined (Cameron & Billington, 2015).
Some definition perspectives
Frith (1999) tried to get to the heart of the definition problem by exploring three levels of description - behavioural, cognitive and biological - but still defined dyslexia as a neuro-biological disorder, which discussed controversial hypothetical deficits and how these impact on the clinical presentation of dyslexia. Despite an attempt to provide a targeted explanation through an analysis of the multifactoral impact of these three levels, this paper still broadly concluded that 'undiagnosable' cultural and social factors together with (at the time) uncomprehended genetically-derived 'brain differences' obfuscate a definitive conclusion. Ramus (2004) took Frith's framework further, firstly by drawing our attention to the diversity of 'symptoms' and argued that neurobiological differences are indeed at the root of phonological processing issues which are characteristic indicators of a dyslexic learning difference (Vellutino et al, 2004). But more so, his study shed early light on these variances as an explanation for the apparent comorbidity of dyslexia with other neurodevelopmental disorders, often presented as sensory difficulties in many domains, for example, visual, motor control and balance, and others, which adds to the challenges in pinning dyslexia down. Although Ramus does not propose a single, new neurobiological model for dyslexia, more so suggests a blending of the existing phonological and magno-cellular theories (see below) into something altogether more cohesive, the claim is that evidence presented is consistent with results from studies in both research domains to date, and so is quite weighty.
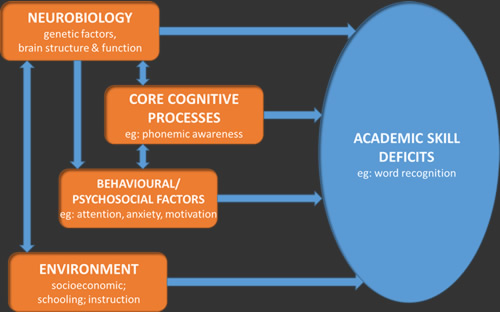 Fletcher (2009), in trying to bring together a summary of more recent scientific understanding of dyslexia, attempts to visualize the competing/contributory factors that can constitute a dyslexic profile in a summary diagram (below) which is helpful. Fletcher adds a dimension to those previously identified by Frith, Ramus, et al by factoring in environmental influences, not the least of which includes social aspects of learning environments, which are likely to be the most impacting factor on learning identity. Mortimore & Crozier (2006) demonstrated that acceptance of dyslexia as part of their learning identity was often something that students new to university were unwilling to embrace, not the least because they felt that the 'fresh start' of a tertiary educational opportunity would enable them to adopt other more acceptable social-learning identities that were deemed more inviting.
One respondent in the current research being partially reported in this paper provided this related, sobering reflection:
- "I don't really like feeling different because people start treating you differently. If they know you have dyslexia, they normally don't want to work with you because of this ... I am surprised I got into university and I am where I am ... and I find it very hard [so] I don't speak in class in case I get [questions] wrong and people laugh" (respondent #85897154, available here)
This highlights aspects of dyslexia which impact on the identity of the individual in ways that mark them as different, in learning contexts at least, and is an element that will be discussed below.
Other explanations rooted in physiology, notably genetics, have encouraged some further interest, notably a paper by Galaburda et al (2006) who claimed to have identified four genes linked to developmental dyslexia following research with rodents, and a more recent study which was concerned with identifying 'risk genes' in genetic architecture (Carion-Castillo et al, 2013). However, scientific as these studies may have been, their conclusions serve as much to prolong the controversy about how to define dyslexia rather than clarify what dyslexia is because these studies add yet another dimension to the dyslexia debate.
 Sensory differences is an explanation that has attracted support from time to time and attributes the manifestations of dyslexia most especially to visual differences - the magnocellular approach to defining dyslexia (Evans, 2003 amongst many others). Whilst there is no doubt that for many, visual stress can impair access to print, this scotopic sensitivity, more specifically referred to as Meares-Irlen Syndrome (MIS), may be a good example of a distinct but co-morbid condition that sometimes occurs alongside dyslexia rather than is an indicator of dyslexia. Later research by Evans & Kriss (2005) accepted this comorbidity idea and found that there was only a slightly higher prevalence of MIS in the individuals with dyslexia in their study in comparison to their control. Common in educational contexts to ameliorate vision differences, especially in universities, there is a long-standing recommendation for tinted colour overlays to be placed on hard-copy text documents, or assistive technologies that create a similar effect for electronic presentation of text. But evidence that this solution for remediating visual stress is more useful for those with dyslexia than for everyone else is sparse or contrary (eg: Henderson et al, 2013) or as one study found, can actually be detrimental to reading fluency, particularly in adults (Denton & Meindl, 2016). So although the relationship between dyslexia and visual stress remains unclear, there is evidence to indicate that there is an interaction between the two conditions which may have an impact on the remediation of either (Singleton &Trotter, 2005).
An alternative viewpoint about the nature of dyslexia is represented by a significant body of researchers who take a strong position based on the notion of 'neuro-diversity'. The BRIAN.HE project (2005), now being revised but with many web resources still active and available, hailed learning differences as a natural consequence of human diversity. Pollak's considerable contribution to this thesis about dyslexia, both through the establishment of BRIAN.HE and notably drawn together in a collection of significant papers (Pollak, 2009), expounds the idea that dyslexia is amongst so-called 'conditions' on a spectrum of neuro-diversity which includes, for example, ADHD and Asperger's Syndrome. Particularly this view supports the argument that individuals with atypical brain 'wiring' are merely at a different place on this spectrum in relation to those others who are supposedly more 'neurotypical'. The greater point here is elegantly put by Cooper (2006), drawing on the social-interactive model of Herrington & Hunter-Carch (2001), and this is the idea that we are all neurodiverse and that it remains society's intolerance to differences that conceptualizes 'neurotypical' as in the majority. This may be particularly apparent in learning contexts where delivering the curriculum through a largely inflexible literacy-based system discriminates against particular presentations of neurodiversity (eg: Cooper, 2009).
The final thesis will present a more detailed review of the various standpoints on what dyslexia is, and especially what it means to be dyslexic based on the evidence from those labelled as such. Additionally, the final thesis will also contain a detailed report on a preliminary enquiry addressed to dyslexia support tutors engaged in universities which was designed to explore their viewpoints on dyslexia. This enquiry was more of a 'straw poll' than a scientific study from which it was merely intended to gain an overview of the current understanding of dyslexia amongst professionals working in their domains of functioning. The enquiry requested participants to create a meritocratic list of definitions of dyslexia from choices provided in a basic questionnaire. Although only 30 responses were received, they represented a broad cross-section of professional colleagues working with students with dyslexia with the results presenting an interesting snapshot of dyslexia in the contemporary context. A preliminary report about this enquiry is available on the project webpages and later on, a deeper analysis of these results obtained will be connected with additional data gathered from students in the main research questionnaire which requested information about how students learned about their dyslexia (reported more fully below). In this way it is hoped insights might be gained on aspects of the impact of the identification process and this will be presented within the final thesis.
So defining dyslexia as a starting point for an investigation is challenging. This causes problems for the researcher because the focus of the study ought to be supported by a common understanding about what dyslexia means because without this, it might be argued that the research outcomes are relational and definition-dependent rather than absolute. However, given the continued controversy about the nature of dyslexia, it is necessary to work within this relatively irresolute framework and nevertheless locate the research and the results and conclusions of the research accordingly.
What seems clear and does seem to meet with general agreement, is that at school-age level, difficulties experienced in phonological processing and the 'normal' development of word recognition automaticity appear to be the root causes of the slow uptake of reading skills and associated challenges with spelling. Whether this is caused by a dyslexia of some description or is simply unexplained poor reading may be difficult to determine. Setting all other variables aside, a skilful teacher or parent will notice that some children find learning to read particularly challenging and this will flag up the possibility that these learners are experiencing a dyslexia.
What also seems clear, is that for learners of above average academic ability but who indicate dyslexia-associated learning challenges - in whatever way both of these attributes are measured - it is reasonable to expect these learners to strive to extend their education to post-secondary levels along with everyone else in their academic peer groups, despite the learning challenges that they face as a result of their learning differences. Amongst many other reasons which include desire for improved economic opportunities resulting from success at university, one significant attraction of higher education is a desire to prove self-worth (Madriaga, 2009). An analysis of HESA data bears out the recent surge in participation rates amongst traditionally under-represented groups at university of which students with disabilities form one significant group (Beauchamp-Prior, 2013). There is plenty of recent research evidence to support this which relates to students entering university with a previously identified learning difference and this will be discussed more fully in the final thesis. But a compounding factor which suggests an even greater prevalence of dyslexia at university beyond data about dyslexic students on entry is indicated through the rising awareness of late-identified dyslexia at university. This is evidenced not the least through interest in creating screening tools such as the DAST (Dyslexia Adult Screening Test, Fawcett & Nicholson, 1998) and the LADS software package (Singleton & Thomas, 2002) to name just two technology-based items which will be discussed further, below. But this is also a measure of the recurring need to develop and refine a screening tool that works at university level which takes more interest in the other learning challenges as additional identifying criteria rather than persist with assessing largely literacy-based skills and the relationship of these to perhaps, speciously-defined, measures of 'intelligence'. This is also discussed a little more and in the context of this paper, below.
Disability, deficit, difficulty or difference?
With the exception of Cooper's description of dyslexia being an example of neuro-diversity rather than a disability, difficulty or even difference, definitions used by researchers and even professional associations by and large remain fixed on the issues, challenges and difficulties that dyslexia presents when engaging with the learning that is delivered through conventional curriculum processes. This approach compounds, or certainly tacitly compounds the 'adjustment' agenda which is focused on the learner rather than the learning environment.
 'Difficulty' or 'disorder' are both loaded with negative connotations that imply deficit, particularly within the framework of traditional human learning experiences in curriculum delivery environments that do remain almost entirely 'text-based'. This is despite the last decade or two of very rapid development of alternative, technology or media-based delivery platforms that have permeated western democracies and much of the alternative and developing worlds. This 'new way' is embraced by an information society that sees news, advertising, entertainment and 'gaming', government and infrastructure services, almost all aspects of human interaction with information being delivered through electronic mediums. And yet formal processes of education by and large remain steadfastly text-based which, although now broadly delivered electronically, still demand a 'conventional' ability to properly and effectively engage with the 'printed word' both to consume knowledge and also to create it. This persistently puts learners with dyslexia - in the broadest context - and with dyslexia-like learning profiles at a continual disadvantage and hence is inherently unjust. An interesting, forward-looking paper by Cavanagh (2013) succinctly highlights this tardiness in the delivery of education and learning to keep up with developments in information diversity and candidly observes that the collective field of pedagogy and andragogy should recognize that, rather than learners, it is curricula that is disabled and hence, needs be fixed – a standpoint that resonates with the underlying rationale that drives this PhD Project.
Cavanagh is one of the more recent proponents of a forward-facing, inclusive vision of a barrier-free learning environment - the Universal Design for Learning (UDL) – which as a 20-year-old 'movement' originating from a seminal paper by Rose & Meyer (2000) is attempting to tackle this issue in ways that would declare dyslexia to be much more widely recognized as, at worst, a learning difference amongst a plethora of others, rather than a learning difficulty or worse, disability. With its roots in the domain of architecture and universal accessibility to buildings and structures, the core focus of UDL is that the learning requirements of all learners are factored into curriculum development and delivery so that every student's range of skills, talents, competencies and challenges are recognized and accommodated without recourse to any kind of differentiated treatment to 'make allowances'. Hence it becomes the norm for learning environments to be much more easily adaptable to learners' needs rather than the other way around. This will ultimately mean that text-related issues, difficulties and challenges that are undoubted deficits in conventional learning systems cease to have much impact in a UDL environment. There is an increasing body of evidence to support this revolution in designing learning in this way, where researchers persistently draw attention to the learning-environment challenges facing different learners, ranging from equitable accommodation into the exciting new emphasis on developing STEM education (eg: Basham & Marino, 2013) to designing learning processes for properly including all students into health professions courses (eg: Heelan, et al, 2015).
However until this revolution is complete, other measures are still required to ensure an element of equitability in learning systems that fail to properly recognize and accommodate learning diversity.
LABELS, CATEGORIES, DILEMMAS OF DIFFERENCE AND INCLUSIVITY
 There are many well-rehearsed arguments that have sought to justify the categorization of learners as a convenient exercise in expediency that is generally justified as essential for establishing rights to differentiated 'support' as the most efficacious forms of intervention (Elliott & Gibbs, 2008). This is support which aims to shoe-horn a learner labelled with 'special needs' into a conventional learning box, by means of the application of 'reasonable adjustments' as remediative processes to compensate for learning challenges apparently attributed to their disability.
Outwardly, this is neat, usually well-meaning, ticks boxes, appears to match learner-need to institutional provision, and apparently 'fixes' the learner in such a way as to level the academic playing field so as to reasonably expect such learners to 'perform' in a fair and comparable way with their peers. Richardson (2009) reported on analysis of datasets provided by HESA that this appears to work for most categories of disabled learners in higher education, also demonstrating that where some groups did appear to be under-performing, this was due to confounding factors that were unrelated to their disabilities.
However some researchers claim that such accommodations can sometimes positively discriminate, leading to unfair academic advantage because the 'reasonable adjustments' that are made are somewhat arbitrarily determined and lack scientific justification (Williams & Ceci, 1999). Additionally, there is an interesting concern that many students who present similar difficulties and challenges when tackling their studies to their learning-disabled peers but who are not officially documented through a process of assessment or identification (that is, diagnosis) are unfairly denied similar access to corresponding levels of enhanced study support. It is exactly this unidentified learning difference that the metric in this research study is attempting to reveal and the development of which is described in detail below. Anecdotal evidence from this researcher's own experience as an academic guide in higher education suggests that at university, many students with learning differences such as dyslexia have no inkling of the fact, which is supported by evidence (for example) from a survey conducted in the late 90s which reported that 43% of dyslexic students at university were only identified after they have started their courses (National Working Party on Dyslexia in HE, 1999).  Indeed it has also been reported that some students, witnessing their friends and peers in possession of newly-provided laptops, study-skills support tutorials and extra time to complete their exams all provided through support funding, go to some lengths to feign difficulties in order to gain what they perceive to be an equivalent-to-their-friends, but better-than-equal academic advantage over others not deemed smart enough to play the system (Harrison et al, 2008, Lindstrom et al, 2011).
But there is some argument to suggest that, contrary to dyslexia being associated with persistent failure (Tanner, 2009), attaching the label of dyslexia to a learner - whatever dyslexia is - can be an enabling and empowering process at university exactly because it opens access to support and additional aids, especially technology which has been reported to have a significantly positive impact on study (Draffan et al, 2007). Some researchers who investigated the psychosocial impacts of being designated as dyslexic have demonstrated that embracing their dyslexia enabled such individuals to identify and use many personal strengths in striving for success, in whatever field (Nalavany et al, 2011). In taking the neurodiversity approach however, Grant (2009) points out that neurocognitive profiles are complicated and that the identification of a specific learning difference might inadvertently be obfuscated by a diagnostic label, citing dyslexia and dyspraxia as being very different situations but which share many similarities at the neurocognitive level. Ho (2004) argued that despite the 'learning disability' label being a prerequisite for access to differentiated provision in learning environments and indeed, civil rights protections, these directives and legislations have typically provided a highly expedient route for officialdom to adopt the medical model of learning disabilities and pay less attention or even ignore completely other challenges in educational systems. 'Learning disabilities' (LD) is the term generally adopted in the US, broadly equivalent to 'learning difficulties' everywhere else, of which it is generally agreed that 'dyslexia' forms the largest subgroup; and the legislation that is relevant here is enshrined in the UK in the Disability Discrimination Act, later followed by the Disability Equality Duty applied across public sector organizations which included places of learning, all replaced by the Equality Act 2010 and the Public Sector Equality Duty 2011. So one conclusion that may be drawn here is that as long as schools, and subsequently universities persist in relying heavily on reading to impart and subsequently to gain knowledge, and require writing to be the principal medium for learners to express their ideas and hence for their learning to be assessed, pathologizing the poor performance of some groups of learners enables institutions to avoid examining their own failures (Channock, 2007).
 Other arguments focus on stigmatization associated with 'difference':
On the disability agenda, many studies examine the relationship between disability and stigma with several drawing on social identity theory. For example, Nario-Redmond et al (2012) in a study about disability identification outlined that individuals may cope with stigma by applying strategies that seek to minimize stigmatized attributes but that often this is accompanied by active membership of stigmatized groups in order to enjoy the benefit of collective strategies as a means of self-protection. Social stigma itself can be disabling and the social stigma attached to disability, not least given a history of oppression and unequal access to many, if not most of society's regimens, is particularly so. Specifically in an education context, there is not necessarily a connection between labels of so-called impairment and the categorization of those who require additional or different provision (Norwich, 1999). Indeed, there is a significant body of research that identifies disadvantages in all walks of life that result from the stigmatization of disabilities (eg: McLaughlin, et al, 2004, Morris & Turnbill, 2007, Trammel, 2009). Even in educational contexts and when the term is arguably softened to 'difficulties' or even more so to 'differences', the picture remains far from clear with one study (Riddick, 2000) suggesting that stigmatization may already exist in advance of labelling, or even in the absence of labelling at all. Sometimes the stigma is more associated with the additional, and sometimes highly visible, learning support - students accompanied by note-takers for example - designed to ameliorate some learning challenges (Mortimore, 2013) with some studies reporting a measurable social bias against individuals with learning disabilities who were perceived less favourably than their non-disabled peers (eg: Tanner, 2009, Valas, 1999,). This was not the least also evidenced from the qualitative data that has been collected in this current research project which will be more deeply analysed later, however an example presented here is representative of many similar others that were received:
Other arguments focus on stigmatization associated with 'difference':
On the disability agenda, many studies examine the relationship between disability and stigma with several drawing on social identity theory. For example, Nario-Redmond et al (2012) in a study about disability identification outlined that individuals may cope with stigma by applying strategies that seek to minimize stigmatized attributes but that often this is accompanied by active membership of stigmatized groups in order to enjoy the benefit of collective strategies as a means of self-protection. Social stigma itself can be disabling and the social stigma attached to disability, not least given a history of oppression and unequal access to many, if not most of society's regimens, is particularly so. Specifically in an education context, there is not necessarily a connection between labels of so-called impairment and the categorization of those who require additional or different provision (Norwich, 1999). Indeed, there is a significant body of research that identifies disadvantages in all walks of life that result from the stigmatization of disabilities (eg: McLaughlin, et al, 2004, Morris & Turnbill, 2007, Trammel, 2009). Even in educational contexts and when the term is arguably softened to 'difficulties' or even more so to 'differences', the picture remains far from clear with one study (Riddick, 2000) suggesting that stigmatization may already exist in advance of labelling, or even in the absence of labelling at all. Sometimes the stigma is more associated with the additional, and sometimes highly visible, learning support - students accompanied by note-takers for example - designed to ameliorate some learning challenges (Mortimore, 2013) with some studies reporting a measurable social bias against individuals with learning disabilities who were perceived less favourably than their non-disabled peers (eg: Tanner, 2009, Valas, 1999,). This was not the least also evidenced from the qualitative data that has been collected in this current research project which will be more deeply analysed later, however an example presented here is representative of many similar others that were received:
- "When I was at school I was told that I had dyslexia. When I told them I wanted to be a nurse [and go to university], they laughed at me and said I would not achieve this and would be better off getting a job in a supermarket" (respondent #48997796, available here)
Similar evidence relating to social bias was recorded by Morris & Turnbill (2007) through their study exploring the disclosure of dyslexia in cohorts of students who successfully made it to university to train as nurses, although it is possible that their similar conclusions to these other studies were confounded by nurses' awareness of workplace regulations relating to fitness to practice. This aspect of disclosure-reluctance has been mentioned earlier. It has also been recorded that the dyslexia (LD) label might even produce a differential perception of future life success and other attributes such as attractiveness or emotional stability despite such a label presenting no indication whatsoever about any of these attributes or characteristics (Lisle & Wade, 2014). Perhaps the most concerning, is evidence that parents and especially teachers may have lower academic expectations of young people attributed with learning disabilities or dyslexia based on a perceived predictive notion attached to the label (Shifrer, 2013, Hornstra et al, 2014) and that in some cases, institutional processes have been reported to significantly contribute to students labelled as 'learning-disabled' choosing study options broadly perceived to be less academic (Shifrer et al, 2013).
 As a key researcher and commentator of many years standing, Stanovich has written extensively on dyslexia, on inclusivity and the impact of the labelling of differences. His approach appears to be principally two-fold. Firstly to fuel the debate about whether dyslexia per se exists, a viewpoint that has emerged from the research and scientific difficulties that he claims arise from attempts to differentiate dyslexia from other poor literacy skills; and secondly that given that dyslexia in some definition or another is a quantifiable characteristic, argues strongly that as long as the learning disability agenda remains attached to aptitude-achievement discrepancy measurement and fails to be a bit more self-critical about its own claims, (Stanovich, 1999), its home in the field of research will advance only slowly. Indeed a short time later he described the learning disabilities field as 'not ... on a scientific footing and continu[ing] to operate on the borders of pseudoscience' (Stanovich, 2005, p103). His position therefore fiercely advocates a more inclusive definition of learning disabilities as being one which effectively discards the term entirely because it is 'redundant and semantically confusing' (op cit, p350) a persistent argument that others echo. Lauchlan & Boyle (2007) broadly question the use of labels in special education, concluding that aside from being necessary in order to gain access for support and funding related to disability legislation, the negative effects on the individual can be considerable and may include stigmatization, bullying, reduced opportunities in life and perhaps more significantly, lowered expectations about what a 'labelled' individual can achieve (ibid, p41) as also reported above. Norwich (1999, 2008, 2010) has written extensively about the connotations of labelling, persistently arguing for a cleaner understanding of differences in educational contexts because labels are all too frequently stigmatizing and themselves disabling, referring to the 'dilemma of difference' in relation to arguments 'for' and 'against' curriculum commonality/differentiation for best meeting the educational needs of differently-abled learners. Armstrong & Humphrey (2008) suggest a 'resistance-accommodation' model to explain psychological reactions to a 'formal' identification of dyslexia, the 'resistance' side of which is typically characterized by a disinclination to absorb the idea of dyslexia into the self-concept, possibly resulting from perhaps more often, negatively vicarious experiences of the stigmatization attached to 'difference', whereas the 'accommodation' side is suggested to take a broadly positive view by making a greater effort to focus and build on the strengths that accompany a dyslexic profile rather than dwell on difficulties and challenges.
 McPhail & Freeman (2005) have an interesting perspective on tackling the challenges of transforming learning environments and pedagogical practices into genuinely more inclusive ones by exploring the 'colonizing discourses' that disenfranchise learners with disabilities or differences through a process of being 'othered'. Their conclusions broadly urge educationalists to have the courage to confront educational ideas and practices that limit the rights of many student groups (ibid, p284). Pollak (2005) reports that one of the prejudicious aspects of describing the capabilities of individuals under assessment is the common use of norm-referenced comparisons. This idea is inherently derived from the long-established process of aligning measurements of learning competencies to dubious evaluations of 'intelligence', standardized as these might be (for example Wechsler Intelligence Scale assessments to identify just one), but which fail to accommodate competencies and strengths which fall outside the conventional framework of 'normal' learning capabilities - that is, in accordance with literacy-dominant education systems. Norwich (2013) also talks more about 'capabilities' in the context of 'special educational needs', a term he agrees, is less than ideal. The 'capability approach' has its roots in the field of welfare economics, particularly in relation to the assessment of personal well-being and advantage (Sen, 1999) where the thesis is about individuals' capabilities to function. Norwich (op cit) puts the capability approach into an educational context by highlighting focus on diversity as a framework for human development viewed through the lens of social justice which is an interesting parallel to Cooper's thesis on diversity taken from a neurological perspective as discussed above. This all has considerable relevance to disability in general but particularly to disability in education where the emphasis on everyone becoming more functionally able (Hughes, 2010) is clearly aligned with the notion of inclusivity and the equal accommodation of difference because the focus is inherently positive as opposed to dwelling on deficits. and connects well with the principles of universal design for learning outlined above.
![]()
Impact of the process of identification
Having said all this, exploring the immediate emotional and affective impact that the process of evidencing and documenting a learner's study difficulties has on the individual under scrutiny is a pertinent and emerging research field. (Armstrong & Humphrey, 2008). Perhaps as an indication of an increasing awareness of the value of finding out more about how an individual with dyslexia feels about their dyslexia, there have been relatively recent research studies that relate life/learning histories of individuals with dyslexia (eg: Dale & Taylor, 2001, Burden & Burdett, 2007, Evans, 2013, Cameron & Billington, 2015, Cameron, 2016). One intriguing study attempts to tease out meaning and understanding from these through the medium of social media (Thomson et al, 2015) where anonymous 'postings' to an online discussion board hosted by a dyslexia support group resulted in three, distinct categories of learning identities being established: learning-disabled, differently-enabled, and societally-disabled. The researchers observed from these postings that while some contributors took on a mantle of 'difference' rather than 'disability', expressing positiveness about their dyslexia-related strengths, most appeared to be indicating more negative feelings about their dyslexia, with some suggesting that their 'disability identity' had been imposed on them (ibid, p1339) not the least arising through societal norms for literacy.
The pilot study that underpins this current research project (Dykes, 2008) also explored feelings about dyslexia which was designed as a secondary aspect of its data collection process but it emerged that individuals responding to the enquiry were keen to express their feelings about their dyslexia and how they felt that it impacted on their studies. In the light of the findings of this earlier research, perhaps it should have been unsurprising to note in this current project, the significant number of questionnaire replies that presented quite heartfelt narratives about the respondents' dyslexia. Some 94% of the 98 QNR replies returned by students with dyslexia included data at this level. The complete portfolio of narratives can be accessed on the project webpages here and it is intended to explore this rich pool of qualitative data as the constraints of the project permit although it is anticipated that it likely that further, post-project research will be required in due course to fully understand it.
It may be through a collective study (in the future) of others' research in this area that conclusions can be drawn relating to the immediate impact on individuals when they learn of their dyslexia. However in the absence of any such meta-analysis being unearthed so far, even a cursory inspection of many of the learning histories presented in studies that have been explored to date generally reveals a variety of broadly negative and highly self-conscious feelings when individuals learn of their dyslexia. Although such reports strongly outweigh those from other learners who claimed a sense of relief that the 'problem' has been 'diagnosed' or that an explanation has been attributed to remediate their feelings of stupidity as experienced throughout earlier schooling, it is acknowledged that there is some evidence of positive experiences associated with learning about ones dyslexia, as reported earlier. This current project aims to be a contributor to this discourse as one facet of the questionnaire used to collect data sought to find out more about how dyslexic students learned about their dyslexia. A development feature of the project will co-relate the disclosures provided to respondents' narratives about how they feel about their dyslexia where this information has also been provided. As yet, a methodology for exploring this has still to be developed and this process may also be more likely to be part of the future research that it is hoped will stem from this current project.
However, and as already explored variously above, it seems clear that in the last two decades at least, many educators and researchers in the broad domain of revisiting the scope and presentation of tertiary-level learning and thinking are promoting a more enlightened view. It is one that rails against the deficit-discrepancy model of learning difference. It seeks to displaces entrenched ideology rooted in medical and disability discourses with one which advocates a paradigm shift in the responsibility of the custodians of knowledge and enquiry in our places of scholarship to one which more inclusively embraces learning and study diversity. There is a growing advocacy that takes a social-constructionist view to change the system rather than change the people (eg: Pollak, 2009), much in line with the Universal Design for Learning agenda briefly discussed above. Bolt-on 'adjustments', well-meaning as they may be, will be discarded because they remain focused on the 'disabling' features of the individual and add to the already burdensome experiences of being part of a new learning community - a factor which of course, affects everyone coming to university.
 To explore this point a little further, an example that comes to mind is technology 'solutions' that are designed to embed alternative practices and processes for accessing and manipulating information into not only so-called 'disabled' learners' but into everyone's study strategies. These are to be welcomed and great encouragement must be given to institutions to experiment with and hopefully adopt new, diverse practices of curriculum delivery although the rapid uptake of this seems unlikely in the current climate of financial desperation and austerity being experienced by many of our universities at this time. Having said this, encouraging or perhaps even requiring students to engage with technology in order to more easily facilitate inclusivity in study environments can raise other additional learning issues such as the investment in time necessary to master the technology (Dykes, 2008). These technologies may also remain too non-individualized nor easy-to-match to the learning strengths and weaknesses of many increasingly stressed students (Seale, 2008). So for differently-abled learners, these 'enabling' solutions may still require the adoption of additional, compensatory study practices, and may often be accompanied by an expectation to have to work and study harder than others in their peer-group in an academy which requires continuous demonstration of a high standard of literacy as a marker of intellectual capability (Cameron & Billington, 2015) and which moves to exclude and stigmatize those who cannot produce the expected academic outcome in the 'right' way (Collinson & Penketh, 2013). Eventually we may see this regime displaced by processes that will provide a much wider access to learning resources and materials that are available in a variety of formats and delivery mediums, the study of which can be assessed and examined through an equally diverse range of processes and procedures that carry equal merit. No apology is made for persistently returning to this point.
To identify or not to identify? - that is the question
 So a dilemma arises about whether or not to (somehow) identify learning differences. On the one hand, there is a clear and strong argument that favours changing the system of education and learning so that difference is irrelevant, whilst on the other, the pragmatists argue that taking such an approach is idealistic and unachievable and that efforts should be focused on finding better and more adaptable ways to 'fix' the learner.
In the short term at least the pragmatists' approach is the more likely one to be adopted but in doing so, constructing an identification process for learning differences that attributes positiveness onto the learning identity of the individual rather than burdens them with negative perceptions of the reality of difference would seem to be a preference. This is important for many reasons, not the least of which is that an assessment/identification/diagnosis that focuses on deficit or makes the 'subject' feel inadequate or incompetent is likely to be problematic however skilfully it may be disguised as a more neutral process. Not the least this may be due to the lasting, negative perception that an identification of dyslexia often brings, commonly resulting in higher levels of anxiety, depressive symptoms, feelings of inadequacy and other negative-emotion experiences which are widely reported (eg: Carroll & Iles, 2006, Ackerman et al, 2007, Snowling et al, 2007). This is especially important to consider in the design of self-report questionnaire processes where replies are likely to be more reliable if the respondents feel that the responses they provide are not necessarily portraying them poorly, particularly so in the self-reporting of sensitive information that may be adversely affected by social influences and which can impact on response honesty (Rasinski et al, 2004).
Devising a process for gauging the level of dyslexia that an individual may present is only of any value in an educational context. Indeed, it is hard to speak of this without referring to severity of dyslexia which is to be avoided - in the context of this paper at least - because it instantly contextualizes dyslexia into the deficit/discrepancy model. However and as already mentioned, in the current climate labelling a learner with a measurable learning challenge does open access to learning support intended to compensate for the challenge. At university level, this access is based on the professional judgment of a Needs Assessor and on an identification of mild, moderate or severe dyslexia, with the extent of learning support that is awarded being balanced against these differentiated categories of disability, even though the differentiation boundaries appear arbitrary and highly subjective. This support in the first instance is financial and economic, notably through the award of the Disabled Students' Allowance (DSA) which provides a substantial level of funding for the purchase of technology, other learning-related equipment and personally-tailored study support tutorials. This is usually in addition to wider 'reasonable adjustments' provided as various learning concessions by the institution, such as increased time to complete exams. To date, and with the exception of a study by Draffan et al (2007) into student experiences with DSA-awarded assistive technology to which one conclusion indicated the significant numbers of recipients electing not to receive training in the use of the technology that they had been supplied with, no other research enquiries have been found so far that explore the extent to which assistive technology provided through the DSA, for example, is effective in properly ameliorating the challenges that face the dyslexic student learning in current university environments, nor indeed to gauge the extent to which this expensive provision is even utilized at all by recipients. Research into the uptake of differentiated study support for students with dyslexia also identified a substantial time lag between a formal needs assessment and the arrival of any technology equipment for many students (Dykes, 2008) which is likely to be a contributing factor to the low uptake of this type of learning support because students simply become tired of waiting for the promised equipment and instead just get on with tacking their studies as best they can. So it comes as no surprise that the award of DSA funding for students with dyslexia is under review at this time as perhaps this is an indication of how financial custodians have also observed the apparent ambivalency towards technology assistance from students in receipt of the funding, which ironically may be more due to systemic failures than to a perceived vacillation amongst students - more of this below.
However, to return to the point, one of the main aspects of this research project is a reliance on finding students at university with an unidentified dyslexia-like profile as a core process for establishing measurable differences in academic agency between identified and unidentified 'dyslexia', with this being assessed through the Academic Behavioural Confidence metric developed by Sander & Sanders (2006). So to achieve this, incorporating some kind of evaluator that might be robust enough to find these students is key to the research methodology. A discussion about how this has been achieved is presented in the next section.
 MEASURING DYSLEXIA - "HOW DYSLEXIC AM I?"
It might be thought that 'measuring dyslexia' is a natural consequence of 'identifying dyslexia' but the commonly used dyslexia screening tools offer, at best, an output that requires interpretation and in UK universities, this is usually the task of a Disability Needs Assessor. Given an indication of dyslexia that results from a screening, what usually follows is a recommendation for a 'full assessment' which, in the UK at least, has to be conducted by an educational psychologist. However even such a comprehensive and daunting 'examination' does not produce much of a useful measurement to describe the extent of the dyslexic difference identified, other than a generally summative descriptor of 'mild', 'moderate' or 'severe', some assessment tools do provide scores obtained on some of the tests that are commonly administered. Nevertheless, these are generally are of use only to specialist practitioners and not usually presented in a format that is very accessible to the individual under scrutiny.
One student encountered in this researcher's role as a dyslexia support specialist at university recounted that on receiving the result of his assessment which indicated that he had a dyslexic learning difference, he asked the assessor: 'well, how dyslexic am I then?' He learned that his dyslexia was 'mild to moderate' which left him none the wiser, he said. One of his (dyslexic) peers later recounted that his view was that he did not think dyslexia was real because he believed that 'everyone if given the chance to prove it, could be a bit dyslexic' (respondent #9, Dykes, 2008, p95). His modest conclusion to account for his learning challenges was that his problem was that he was just not as intelligent as others, or thought that perhaps his lack of confidence from an early age decreased his mental capacity.
On the one hand, certainly for school-aged learners, identifying dyslexia is rooted in establishing capabilities that place them outside the 'norm' in assessments of competencies in phonological decoding and automaticity in word recognition for example, and in other significantly reading-based evaluations. This has been mentioned briefly earlier. Some identifiers include an element of assessment of working memory such as the digit span test, which has relevance to dyslexia because working memory abilities have clear relationships with comprehension. If a reader gets to the end of a long or complex sentence but fails to remember the words at the beginning long enough to connect with the words at the end then clearly this compromises understanding. All of these identifiers also carry quantifiable measures of assessment although they are discretely determined and not coalesced into an overall score or value. Besides, there is widespread agreement amongst psychologists, assessors and researchers that identifiers used for catching the dyslexic learner at school do not scale up very effectively for use with adults (eg: Singleton et al, 2009). This may be especially true for the academically able learners that one might expect to encounter at university who can, either actively or not, mask their difficulties (Casale, 2015) or even feign them if they perceive advantage to be gained (Harrison et al, 2008) as also reported above. However, recent studies continue to reinforce the idea that dyslexia is a set of quantifiable cognitive characteristics (Cameron, 2016) but which extend beyond the common idea that dyslexia is mostly about poor reading, certainly once our learner progresses into the university environment.
 So the last two decades or so have seen the development of a number of assessments and screening tests that aim to identify – but not specifically to measure - dyslexia in adults and particularly in higher education contexts as a response to the increasing number of students with dyslexia attending university. Aside from this being a route towards focused study skills support interventions, when a screening for dyslexia indicates that a full assessment from an educational psychologist is prudent, this becomes an essential component for any claim to the Disabled Students' Allowance (DSA) although ironically the assessment has to be financed by the student and is not recoverable as part of any subsequent award. It is of note, however, that with a recent refocusing of the target group of disabled students who are able to benefit from the DSA (Willetts, 2014) access to this element of support is likely to be withdrawn for the majority of students with dyslexia at university in the foreseeable future although for this current academic year (2016/17) it is still available. This may be an indication that dyslexia is no longer 'officially' considered as a disability, which is at least consistent with the standpoint of this research project, although it is more likely that the changes are as a direct result of reduced government funding to support students with additional needs at university rather than any greater understanding of dyslexia based on informed, research-based recommendations.
An early example of a screening assessment for adults is the DAST (Dyslexia Adult Screening Test) developed by Nicholson & Fawcett (1997). This is a modified version of an earlier screening tool used with school-aged learners but which followed similar assessment principles, that is, being mostly based on literacy criteria although the DAST does include non-literacy based tests, namely a posture stability test – which seems curiously unrelated although it is claimed that its inclusion is substantiated by pilot-study research - a backward digit span test and a non-verbal reasoning test. Literature review appears to indicate that some researchers identify limitations of the DAST to accurately identify students with specific learning disabilities, for example Harrison & Nichols (2005) felt that their appraisal of the DAST indicated inadequate validation and standardization. Computerized screening tools have been available for some time, such as the LADS (Lucid Adult Dyslexia Screening, (Lucid Innovations, 2015)) which claims to generate a graphical report that collects results into a binary categorization of dyslexia as the individual being 'at risk' or 'not at risk'. Aside from being such a coarse discriminator, 'at risk' again appears to be viewing dyslexia through the lens of negative and disabling attributes. The screening test comprises 5 sub-tests which measure nonverbal reasoning, verbal reasoning, word recognition, word construction and working memory (through the backward digit span test) and indicates that just the final three of these sub-tests are dyslexia-sensitive. The reasoning tests are included based on claims that to do so improves screening accuracy and that results provide additional information 'that would be helpful in interpreting results' (ibid, p13), that is, provides a measure of the individual's 'intelligence' - which, in the light of Stanovich's standpoint on intelligence and dyslexia mentioned earlier, is of dubious worth.
 Warmington et al (2013) responded to the perception that dyslexic students present additional learning needs in university settings, implying that as a result of the increased participation in higher education in the UK more generally there is likely to be at least a corresponding increasing in the proportion of students who present disabilities or learning differences. Incidentally,, Warmington et al quotes HESA figures for 2006 as 3.2% of students entering higher education with dyslexia. A very recent enquiry directly to HESA elicited data for 2013/14 which indicated students with a learning disability accounting for 4.8% of the student population overall (Greep, 2015), and also representing some 48% of students disclosing a disability, which certainly will make students with dyslexia the biggest single group of students categorized with disabilities at university, such that they are currently labelled. It is of note that the HESA data is likely to be an under-reporting of students with a learning disability - that is, specific learning difficulty (dyslexia) because where this occurs together with other impairments or medical/disabling conditions this is reported as a separate category with no way of identifying the multiple impairments. At any rate, both of these data are consistent with the conclusions that the number of students with dyslexia entering university is on the rise. Given earlier mention above about dyslexia being first-time identified in a significant number of students post-entry it is reasonable to suppose that the actual proportion of dyslexic students at university is substantial. Indeed, this research is relying on finding 'hidden' dyslexics in the university community in order to address the research questions and hypothesis.
The York Adult Assessment-Revised (YAA-R) was the focus of the Warmington et al study which reported data from a total of 126 students of which 20 were known to be dyslexic. The YAA-R comprises several tests of reading, writing, spelling, punctuation and phonological skills that is pitched most directly to assess the abilities and competencies of students at university (ibid, p49). The study concluded that the YAA-R has good discriminatory power of 80% sensitivity and 97% specificity but given that the focus of the tests is almost entirely on literacy-based activities, it fails to accommodate assessments of the wide range of other strengths and weaknesses often associated with a dyslexic learning profile that are outside the envelope of reading, writing and comprehension. A similar criticism might be levelled at the DAST as this largley focuses on measuring literacy-based deficits. Indeed, Channock et al (2010) trialed a variation of the YAA-R adjusted in Australia to account for geographical bias in the UK version as part of a search for a more suitable assessment tool for dyslexia than those currently available. Conclusions from the trial with 23 dyslexic students and 50 controls were reported as 'disappointing' due not 'to the YAA-R's ability to differentiate between the two groups, but with it's capacity to identify any individual person as dyslexic' (ibid, p42) as it failed to identify more than two-thirds of previously assessed dyslexic students as dyslexic. Channock further narrates that self-reporting methods proved to be a more accurate identifier - Vinegrad's (1994) Adult Dyslexia Checklist was the instrument used for the comparison. A further criticism levelled at the YAA-R was that it relied on data collected from students in just one HE institution, suggesting that that differences between students in different institutions was an unknown and uncontrollable variable which was not accounted for but which might influence the reliability and robustness of the metric.
Aside from the use of norm-referenced evaluations for identifying dyslexia as a discrepancy between intellectual functioning and reading ability being controversial, one interesting study highlighted the frequently neglected factors of test reliability and error associated with a single test score, with a conclusion that a poor grasp of test theory and a weak understanding of the implications of error can easily lead to misdiagnosis (Cotton et al, 2005) in both directions – that is, generating both false positives and false negatives.
Tamboer & Vorst (2015) developed an extensive self-report questionnaire-based assessment to screen for dyslexia in students attending Dutch universities. Divided into three sections: biographical questions, general language statements, and specific language statements, which although still retaining a strong literacy-based focus, this assessment tool does include items additional to measures of reading, writing and copying, such as speaking, dictation and listening. In the 'general language statements' section some statements also referred to broader cognitive and study-related skills such as 'I can easily remember faces' or 'I find it difficult to write in an organised manner'. This seems to be making a better attempt at developing processes to gauge a wider range of attributes that are likely to impact on learning and study capabilities in the search for an effective identifier for dyslexia in university students. This model is consistent with an earlier self-report screening assessment which in its design, acknowledged that students with dyslexia face challenges at university that are in addition to those associated with weaker literacy skills (Mortimore & Crozier, 2006). In contrast to Channock's findings concerning the YAA-R reported above, Tamboer & Voorst's assessment battery correctly identified the 27 known dyslexic students in their research group - that is, students who had documentary evidence as such - although it is unclear how the remaining 40 students in the group of 67 who claimed to be dyslexic were identified at the pre-test stage. Despite this apparent reporting anomaly, this level of accuracy in identification is consistent with their wider review of literature concluding that there is good evidence to support the accuracy of self-report identifiers (ibid, p2).
 It might be thought that 'measuring dyslexia' is a natural consequence of 'identifying dyslexia' but the commonly used dyslexia screening tools offer, at best, an output that requires interpretation and in UK universities, this is usually the task of a Disability Needs Assessor. An indication of dyslexia that results from a screening is usually followed by a recommendation for a 'full assessment' which, in the UK at least, has to be conducted by an educational psychologist (EP). In addition, it is widely reported (and mentioned elsewhere in this paper) that identifying dyslexia in adults is more complicated than in children, especially in broadly well-educated adults attending university because many of the early difficulties associated with dyslexia have receded as part of the progression into adulthood either as a result of early support or through self-developed strategies to overcome them (Singleton et al, 2009). However even when strong indicators of dyslexia persist, such a comprehensive and daunting 'examination' by an EP is unlikely to produce much of a useful measurement to describe the extent of the dyslexic difference identified, other than a generally summative descriptor such as 'mild', 'moderate' or 'severe'. Some assessment tools do provide scores obtained on some of the tests that are commonly administered but these are generally only meaningful to specialist practitioners and not usually presented in a format that is very accessible to the assessed individual.
Thus, in none of the more recently developed screening tools is there mention of a criterion that establishes how dyslexic a dyslexic student is - that is, the severity of the dyslexia (using 'severity' advisedly as in itself, the term reverts to the model that to be dyslexic is to be disadvantaged, as mentioned earlier). Elliott & Grigorenko (2014) claim that a key problem in the development of screening tools for dyslexia is in setting a separation boundary between non-dyslexic and dyslexic individuals that is reliable and which cuts across the range of characteristics or attributes that are common in all learners in addition to literacy-based ones and especially for adults in higher education. To this end, it was felt that none of the existing evaluators would be able to not only accurately identify a dyslexic student from within a normative group of university learners - that is, students who include none previously identified as dyslexic nor any who are purporting to be dyslexic - but also be able to ascribe a measure of the dyslexia to the identification. In addition, and given the positive stance that this project takes towards including learners with dyslexia-like profiles into an integrated and universal learning environment, the design of the evaluator needed to ensure that all students who used it felt that they are within its scope and that it would not reveal a set of study attributes that were necessarily deficit- nor disability-focused. For this research at least, it was felt that such a metric should be developed and needs to satisfy the following criteria:
- it is a self-report tool requiring no administrative supervision;
- it is not entirely focused on literacy-related evaluators, and attempts to cover the range of wider academic issues that arise through studying at university;
- it includes some elements of learning biography;
- its self-report stem items are equally applicable to dyslexic as to apparently non-dyslexic students;
- it is relatively short as it would be part of a much larger self-report questionnaire collecting data about the 7 other metrics that are being explored in this research project;
- it draws on previous self-report dyslexia identifiers which could be adapted to suit the current purpose to add some prior, research-based validity to the metric;
- the results obtained from it will enable students to be identified who appear to be presenting dyslexia-like attributes but who have no previous identification of dyslexia;
- through further development work in due course, it will connect with the psychometric profile maps (available here), generated from data also collected in the main project questionnaire, in ways that are bidirectional, leading to a validation of the profile maps as an additional discriminator for identifying dyslexia in higher education students. [The profile maps reflect the data collected on the 6 psychometric scales: Learning Related Emotions (LRE), Anxiety Regulation & Motivation (ARM), Academic Self-efficacy (ASE), Self-esteem (SE). Learned Helplessness (LH) and Academic Procrastination (AP). More about these is available on the project's webpages].
![]() This metric is being described as the Dyslexia Index of a student's learning profile and will attempt to collectively quantify learning, study and learning-biography attributes and characteristics into a comparative measure which can be used as a discriminator between students presenting a dyslexic or a non-dyslexic profile. The measure is akin to a coefficient and hence adopts no units. The tool that has been developed to generate the index value will be referred to as the Dyslexia Index Profiler, and Dyslexia Index will be frequently abbreviated to Dx. This is all despite the researcher's unease with the use of the term 'dyslexia' as a descriptor of a wide range of learning and study attributes and characteristics that can be observed and objectively assessed in all learners in university settings. However, in the interests of expediency, the term will be used throughout this study.
This metric is being described as the Dyslexia Index of a student's learning profile and will attempt to collectively quantify learning, study and learning-biography attributes and characteristics into a comparative measure which can be used as a discriminator between students presenting a dyslexic or a non-dyslexic profile. The measure is akin to a coefficient and hence adopts no units. The tool that has been developed to generate the index value will be referred to as the Dyslexia Index Profiler, and Dyslexia Index will be frequently abbreviated to Dx. This is all despite the researcher's unease with the use of the term 'dyslexia' as a descriptor of a wide range of learning and study attributes and characteristics that can be observed and objectively assessed in all learners in university settings. However, in the interests of expediency, the term will be used throughout this study.
To recap: the principle focus of this research project is exploring the linkage between dyslexia and academic agency in higher education students. Zimmerman (1995) neatly explained that academic agency can be thought of as a sense of [academic] purpose, this being a product of self-efficacy and academic confidence and which is then the major influence on academic accomplishment (ibid). An extensive review of academic agency in the context of its applicability to university learning is beyond the scope of this project, but specifically in relation to its major component factors – those of academic self-efficacy and academic confidence – a detailed review will be presented in the final thesis with an preliminary discussion available here. Thus, given that the construct of academic agency is an umbrella term for at least the two more specific sub-constructs mentioned, this research project concentrates particularly on the attribute of academic confidence and this has been explored through the use of Sander & Sanders (2006) metric, the Academic Behavioural Confidence Scale – originally a 24-item scale and which is included in the main research questionnaire. Although originally developed as the Academic Confidence Scale, it was renamed following a review of the structure and focus which identified a keener applicability to actions and plans related to academic study (ibid). Hence measurements about student confidence acquired through the ABC Scale will be the the 'output variable' from which comparisons will be made between students with identified dyslexia, students with hidden and unidentified dyslexia-like profile and non-dyslexic students, as determined through the 'input variable' of Dyslexia Index. A brief summary of results obtained to date is presented in the final section of this paper, below, and these appear to be indicating that there are clearly measurable and significant differences to report.
DYSLEXIA INDEX
This metric has been devised and developed to satisfy the criteria above. It has been constructed following review of dyslexia self-identifying evaluators such as the BDA's Adult Checklist developed by Smythe and Everatt (2001), the original Adult Dyslexia Checklist proposed by Vinegrad (1994) upon which many subsequent checklists appear to be based, and the much later, York Adult Assessment (Warmington et al, 2012) which has a specific focus as a screening tool for dyslexia in adults and which, despite the limitations outlined earlier, was found to be usefully informative. Also consulted and adapted has been work by Burden, particularly the 'Myself as a Learner Scale' (Burden, 2000), the useful comparison of referral items used in screening tests which formed part of a wider research review of dyslexia by Rice & Brooks (2004) and more recent work by Tamboer & Vorst (2015) where both their own self-report inventory of dyslexia for students at university and their useful overview of other previous studies were consulted.
It is widely reported that students at university, by virtue of being sufficiently academically able to progress their studies into higher education, have frequently moved beyond many of the early literacy difficulties that may have been associated with their dyslexic learning differences and perform competently in many aspects of university learning (Henderson, 2015). However the nature of study at university requires students to quickly develop their generic skills in independent self-managed learning and individual study capabilities, and enhance and adapt their abilities to engage with, and deal resourcefully with learning challenges generally not encountered in their earlier learning histories (Tariq & Cochrane, 2003). Difficulties with many of these learning characteristics or 'dimensions' that may be broadly irrelevant or go un-noticed in children, may only surface when these learners make the transition into the university learning environment. Many students struggle to deal with these new and challenging learning regimes, whether dyslexic or not and this has seen many, if not most universities developing generic study-skills and/or learning development facilities and resources to support all students in the transition from managed to self-managed learning. Indeed, for many who subsequently learn of their dyslexia, gaining an understanding about why they may be finding university increasingly difficult, and even more so than their friends and peers, does not happen until their second or third year of study. One earlier research paper established that more than 40% of students with dyslexia only have their dyslexia identified during their time at university (Singleton et al, 1999) and given acknowledgement that widening participation and alternative access arrangements for entry to university in the UK has certainly increased the number of students from under-represented groups moving into university learning (Mortimore, 2013) although given higher participation in higher education generally it is the proportion rather than the number that might be a better indicator, it is nevertheless possible that this estimate remains reasonable, and might further suggest that many dyslexic students progress to the end of their courses remaining in ignorance of their learning difference, and indeed many also will gain a rewarding academic outcome in spite of this suggesting that their dyslexia, such that it may be, is irrelevant to their academic competency and indeed, has had little impact on their academic agency.
But there are many reasons why dyslexia is not identified at university and a more comprehensive discussion about this will be presented in the final thesis. However one explanation for this late, or non-identification may be because these more, 'personal management'-type dimensions of dyslexia are likely to have had little impact in themselves on earlier academic progress because school-aged learners are supervised and directed more closely in their learning at those stages. At university however, the majority of learning is self-directed, with successful academic outcomes relying more heavily on the development of effective organizational and time-management skills which may not have been required in earlier learning (Jacklin et al, 2007). So because the majority of the existing metrics appear to be weak in gauging many of the study skills and academic competencies, strengths and weaknesses of students with dyslexia that may either co-exist with persistent literacy-based deficits or have otherwise displaced them, this raised a concern about using any of these metrics per se, a concern shared by many educators working face-to-face with university students (eg: Chanock et al, 2010, Casale, 2013) where there has been a recent surge in calls for alternative assessments which more comprehensively gauge a wider range of study attributes, preferences and characteristics.
So two preliminary enquiries were developed that sought to find out more about how practitioners are supporting and working with students with dyslexia in UK universities with a view to guiding the development of the Dyslexia Index on the basis that grounding it in the practical experiences of working with students with dyslexia in university contexts could be a valuable alternative to basing the profiler on theory alone. The first enquiry aimed to find out more about the kind of working definition of dyslexia that these practitioners were adopting, results are reported on the project webpages and will be more deeply explored later with a full analysis presented in the final thesis. The second aimed to explore the prevalence of attributes and characteristics associated with dyslexia that were typically encountered by these practitioners in their direct interactions with dyslexic students at university on a day-to-day basis. The results of this second enquiry have been used as the basis for building the Dyslexia Index Profiler and are reported in the next section.
Construction of the Dyslexia Index (Dx) profiler
The Dyslexia Index (Dx) profiler forms the final 20-item Likert scale on the main research questionnaire for this project which has been deployed to students during the summer term of 2016. This final section of the main QNR addresses respondents to:
- 'reflect on other aspects of approaches to your studying or your learning history - perhaps related to difficulties you may have had at school - and also asks about your time management and organizational skills more generally.'
The bank of 20 'leaf' statements comprise the 18 statements from the baseline enquiry (as detailed below) plus two additional statements relating to learning biography:
- 'When I was learning to read at school, I often felt I was slower than others in my class';
- 'In my writing at school I often mixed up similar letters like 'b' and 'd' or 'p' and 'q'.
and these leaf statements are collectively preceded by the 'stem' statement: 'To what extent do you agree or disagree with these statements ...'. Respondents register their level of acquiesence using the input-variable slider by adjusting its position along a range from 0% to 100% with the value on the final position being presented in an output window. The complete main research questionnaire of which this metric comprises the final section, is available to view here.
Each respondent's results were collated into a spreadsheet, adjusted where specified (through reverse-coding some data, for example - details below) and the Dyslexia Index (Dx) is calculated as the weighted mean average of the input-values that the respondent set against each of the leaf statements. The final calculation generates a value between 0 < Dx < 1000. The process of weighting the input-value for each leaf statement arises from analysis of the data collected in the baseline enquiry whereby the weighting applied is derived from the mean average prevalence of each attribute, or 'dimension' of dyslexia that emerged from that data.
An attempt has been made to try choose the wording of the leaf statements carefully so that the complete bank has a balance of positively-worded, negatively-worded and neutral statements overall. There is evidence that to ignore this feature of questionnaire design can impact on internal consistency reliability although this practice, despite being widespread in questionnaire design, remains controversial (Barnette, 2000) with other more recent studies reporting that the matter is far from clear and requires further research (Weijters et al, 2010). A development of this Dyslexia Index Profiler will be to explore this issue in more depth.
A working trial of a standalone version of the Dyslexia Index profiler which produces an immediate Dx value is available here but which, it is stressed, has been created and published online initially to support this paper, although it is hoped that further development will be possible, most likely as a research project beyond this current study. So it must be emphasized that this is only a first-development profiler that has emerged from the main research questionnaire data analysis to date and has a slightly reduced, 16-item format. Details about how this has been developed will be presented in the final thesis as constraints in this paper prevent a comprehensive reporting of the development process here.
Baseline enquiry: collecting data about the pervalence of 'dimensions' of dyslexia
This tool aimed to collect data about the prevalence and frequency of attributes, that is, dimensions of dyslexia encountered by dyslexia support professionals in their interactions with dyslexic students at their universities. An electronic questionnaire (eQNR) was designed, built and hosted on this project's webpages, available here . A link to the eQNR was included in an introduction and invitation to participate, sent by e-mail to 116 of the UK Higher Education institutions listed on the Universities UK database. The e-mail was directed to each university's respective student service for students with dyslexia where this could be established from universities' webpages (which was most of them) or otherwise to a more general university enquiries e-mail address. Only 30 replies were received which was disappointing, although it was felt that the data in these replies was rich enough to provide substantive enough baseline data which could positively contribute to the development of the Dyslexia Index Profiler and hence it could incorporated into the project's main research questionnaire scheduled for deployment to students later on.
The point of this preliminary enquiry was twofold:
• by exploring the prevalence of attributes (dimensions) of dyslexia observed 'at the chalkface' rather than distilled through theory and literature, it was hoped that this data would confirm that the dimensions being gauged through the enquiry were indeed significant features of the learning and study profiles of dyslexic students at university. A further design feature of the enquiry was to provide space for respondents to add other dimensions that they had encountered and which were relevant. These are shown below together with comments about how they were dealt with;
• through analysis of the data collected, value weightings would be ascribed to the components of the Dyslexia Index Profiler when it was built and incorporated into the main research questionnaire. This was felt to be a very important aspect of this preliminary enquiry because it was an attempt to establish the relative prevalence of dimensions as it was felt that this could be a highly influential factor in determining a measure of dyslexia, this being the most important feature of the profiler so that it could be utilised as a discriminator between dyslexic and non-dyslexic students.
A main feature of the design of the eQNR, was to discard the conventionally-favoured Likert scale-item discrete scale-point anchors with input-range sliders to displace to enable respondents to record their inputs. The advent of this relatively new browser functionality has seen electronic data-gathering tools begin to use input-range sliders more readily following evidence that doing so can reduce the impact of input errors, especially in the collection of measurements of constructs that are representative individual characteristics, typically personality (Ladd, 2009), or other psychological characteristics. Controversy also exists relating to the nature of discrete selectors for Likert scale items because data collected through typically 5- or 7-point scales needs to be coded into a numerical format to permit statistical analysis. The coding values used are therefore arbitrary and coarse-grained and the controversy relates to the dilemma about using parametric statistical analysis processes with what is effectively non-parametric data - that is, it is discrete, interval data rather than continuous. (Brown, 2011, Carifio & Perla, 2007 & 2008, Jamieson, 2004, Murray, 2013, Norman, 2010, Pell, 2005). Through using input-range slider functionality, this not only addresses these issues because the outputs generated, although technically still discrete because they are integer values, nevertheless provide a much finer grading and hence may be more justifiably used in parametric analysis. This baseline enquiry also served the very useful purpose of testing the technology and gaining feedback about its ease of use to determine whether it was robust enough and sufficiently accessible to use in the in the project's main student-questionnaire later or should be discarded in favour of more conventionally constructed Likert scales items. Encouraging feedback was received, so the process was indeed included in the main research questionnaire deployed to students.
In this preliminary enquiry 18 attributes, 'dimensions', of dyslexia were set out in the eQNR collectively prefixed by the question:
• 'In your interactions with students with dyslexia, to what extent do you encounter each of these dimensions?'
In the QNR, each Likert-style stem statement refers to one dimension of dyslexia. 18 dimensions were presented and respondents were requested to judge the frequency that each dimension was encountered in interactions with dyslexic students as a percentage of all interactions with dyslexic students. For example in the statement: "students show evidence of being disorganized most of the time" a respondent who judged that they 'see' this dimension in 80% of all their dyslexic student interactions would return '80%' as their response to this stem statement. It was anticipated that respondents would naturally dis-count repeat visitors from this estimate although to do so was not made explicit in the instructions as it was felt that this would over-complicate the preamble to the questionnaire. It is recognized that there is a difference between 80% of students being 'disorganized' and 'disorganization' being encountered in 80% of interactions with students. However it was felt that since an overall 'feel' for prevalence was the aim for the questionnaire, the difference was as much a matter of syntax as much as distinctive meaning and so either interpretation from respondents would be acceptable. Respondents were requested to record their estimate by moving each slider along a continuous scale ranging from 0% to 100% according to the guidelines at the top of each of the 18 leaf statements. The default position for the slider was set at 50%. With hindsight, it may have been better to have set the default position at 0% in order to encourage respondents to be properly active in responding rather than somewhat inert with some statements that were considered with ambivalence which may have been the case with the default set at 50%. This could only have been established by testing prior to deployment for which time was not available. Research to inform this is limited at present as the incorporation of continuous rating scales in online survey research is relatively new technology although the process is now becoming easier to implement and hence is attracting research interest (eg: Treiblmaier & Flizmoser, 2011).
The 18 leaf statements, labelled 'Dimension 01 ... 18' are:
- students’ spelling is generally very poor
- students say that they find it very challenging to manage their time effectively
- students say that they can explain things more easily verbally than in their writing
- student show evidence of being very disorganized most of the time
- in their writing, students say that they often use the wrong word for their intended meaning
- students seldom remember appointments and/or rarely arrive on time for them
- students say that when reading, they sometimes re-read the same line or miss out a line altogether
- students show evidence of having difficulty putting their writing ideas into a sensible order
- students show evidence of a preference for mindmaps or diagrams rather than making lists or bullet points when planning their work
- students show evidence of poor short-term (and/or working) memory – for example: remembering telephone numbers
- students say that they find following directions to get to places challenging or confusing
- when scoping out projects or planning their work, students express a preference for looking at the ‘big picture’ rather than focusing on details
- students show evidence of creative or innovative problem-solving capabilities
- students report difficulties making sense of lists of instructions
- students report regularly getting their ‘lefts’ and ‘rights’ mixed up
- students report their tutors telling them that their essays or assignments are confusing to read
- students show evidence of difficulties in being systematic when searching for information or learning resources
- students are very unwilling or show anxiety when asked to read ‘out loud’
It is acknowledged that this does not constitute an exhaustive list of dimensions and in the preamble to the questionnaire this was identified. In order to provide an opportunity for colleagues to record other, common (for them at least) attributes encountered during their interactions with students, a 'free text area' was included and placed at the foot of the questionnaire for this purpose. Where colleagues listed other attributes, they were also requested to provide a % indication of the prevalence. In total, an additional 24 attributes were reported with 16 of these indicated by just one respondent each. 2 more were reported by each of 6 further respondents, 1 more reported by each of 3 respondents and 1 more reported by 4 respondents. To make this clearer to understand, the complete set is presented below:
| Additional attribute reported | % prevalence | |||
| poor confidence in performing routine tasks | 90 | 85 | 80 | *n/r |
| slow reading | 100 | 80 | *n/r | |
| low self-esteem | 85 | 45 | ||
| anxiety related to academic achievement | 80 | 60 | ||
| pronunciation difficulties / pronunciation of unfamiliar vocabulary | 75 | 70 | ||
| finding the correct word when speaking | 75 | 50 | ||
| difficulties taking notes and absorbing information simultaneously | 75 | *n/r | ||
| getting ideas from 'in my head' to 'on the paper' | 60 | *n/r | ||
| trouble concentrating when listening | 80 | |||
| difficulties proof-reading | 80 | |||
| difficulties ordering thoughts | 75 | |||
| difficulties remembering what they wanted to say | 75 | |||
| poor grasp of a range of academic skills | 75 | |||
| not being able to keep up with note-taking | 75 | |||
| getting lost in lectures | 75 | |||
| remembering what's been read | 70 | |||
| difficulties choosing the correct word from a spellchecker | 60 | |||
| meeting deadlines | 60 | |||
| focusing on detail before looking at the 'big picture' | 60 | |||
| difficulties writing a sentence that makes sense | 50 | |||
| handwriting legibility | 50 | |||
| being highly organized in deference to 'getting things done' | 25 | |||
| having to re-read several times to understand meaning | n/r | |||
| profound lack of awareness of their own academic difficulties | *n/r | |||
| (* n/r = % not reported) | ||||
It is interesting to note that the additional attribute most commonly reported referred to students' confidence in performing routine tasks, by which it is assumed is meant 'academic tasks'. It was felt that this provided encouragement that the more subjective self-report, Academic Behavioural Confidence scale that is incorporated into the main research questionnaire would account for this attribute as expected, and that to factor the construct of 'confidence' into the Dyslexia Index Profiler would not be necessary. However this may be a consideration for the future development of the stand-alone Profiler in due course.
Data collected from the questionnaire replies was collated into a spreadsheet and in the first instance, simple statistics were calculated to provide the mean average prevalence for each dimension, together with the standard deviation for the dataset and the standard error so that 95% confidence intervals for the background population means for each dimension could be established to provide an idea of variability. The most important figure is the sample mean prevalence because this indicates the average frequency that each of these dimensions were encountered by dyslexia support professionals in university settings. For example, the dimension that was encountered with the greatest frequency on average, is 'students show evidence of having difficulty putting their writing ideas into a sensible order' with a mean average prevalence of close to 76%. The table below presents the dimensions according to the average prevalence which in itself presents an interesting picture of 'in the field' encounters and it notable that the top three dimensions appear to be particularly related to organizing thinking. A deeper analysis of these results will be reported in due course.
Interesting in itself as this data is, the point of collecting it has been to inform the development of the Dyslexia Index (Dx) Profiler to be included in the main research questionnaire and it was felt that there was sufficient justification to include all 18 dimensions into the Dx Profiler but that to attribute them all with an equal weighting would be to dismiss the relative prevalence of each dimension, determined from their rankings of mean prevalence shown in the table below. So by aggregating input-values assigned to each dimension in the Dx Profiler on a weighted mean basis it was felt that the result, as presented by the Dyslexia Index value, would be a more representative indication of any one respondent presenting a dyslexia-like profile of study attributes or not. Hence this may then be a much more reliable discriminator for sifting out 'unknown' dyslexic students from the wider research group of (declared) non-dyslexic students.
| dim# | Dyslexia dimension | mean prevalence | st dev | st err | 95% CI for µ |
| 8 | students show evidence of having difficulty putting their writing ideas into a sensible order | 75.7 | 14.75 | 2.69 | 70.33 < µ < 81.07 |
| 7 | students say that when reading, they sometimes re-read the same line or miss out a line altogether | 74.6 | 14.88 | 2.72 | 69.15 < µ < 79.98 |
| 10 | students show evidence of poor short-term (and/or working) memory - for example, remembering telephone numbers | 74.5 | 14.77 | 2.70 | 69.09 < µ < 79.84 |
| 18 | students are very unwilling or show anxiety when asked to read 'out loud' | 71.7 | 17.30 | 3.16 | 65.44 < µ < 78.03 |
| 3 | students say that they can explain things more easily verbally than in their writing | 70.6 | 15.75 | 2.88 | 64.84 < µ < 76.30 |
| 16 | students report their tutors telling them that their essays or assignments are confusing to read | 70.4 | 14.60 | 2.67 | 65.09 < µ < 75.71 |
| 2 | students say that they find it very challenging to manage their time effectively | 69.9 | 17.20 | 3.14 | 63.67 < µ < 76.19 |
| 17 | students show evidence of difficulties in being systematic when searching for information or learning resources | 64.3 | 19.48 | 3.56 | 57.21 < µ < 71.39 |
| 13 | student show evidence of creative or innovative problem-solving capabilities | 63.2 | 19.55 | 3.57 | 56.08 < µ < 70.32 |
| 4 | students show evidence of being very disorganized most of the time | 57.2 | 20.35 | 3.72 | 49.79 < µ < 64.61 |
| 12 | when scoping out projects or planning their work, students express a preference for looking at the 'big picture' rather than focusing on details | 57.1 | 18.00 | 3.29 | 50.58 < µ < 63.69 |
| 9 | students show evidence of a preference for mindmaps or diagrams rather than making lists or bullet points when planning their work | 56.7 | 17.44 | 3.18 | 50.32 < µ < 63.01 |
| 1 | students' spelling is generally poor | 52.9 | 21.02 | 3.84 | 45.22 < µ < 60.52 |
| 11 | student say that they find following directions to get to places challenging or confusing | 52.3 | 20.74 | 3.79 | 44.78 < µ < 59.88 |
| 14 | students report difficulties making sense of lists of instructions | 52.0 | 22.13 | 4.04 | 43.98 < µ < 60.09 |
| 15 | students report regularly getting their 'lefts' and 'rights' mixed up | 51.7 | 18.89 | 3.45 | 44.83 < µ < 58.57 |
| 5 | in their writing, students say that they often use the wrong word for their intended meaning | 47.8 | 20.06 | 3.66 | 40.46 < µ < 55.07 |
| 6 | students seldom remember appointments and/or rarely arrive on time for them | 35.7 | 19.95 | 3.64 | 28.41 < µ < 42.93 |
The graphic below shows the relative rankings of all 18 dimensions again, but with added, hypothetical numbers of interactions with dyslexic students in which any particular dimension would be presented based on the mean average prevalence. These have been calculated by assuming a baseline number of student interactions of 100 for each questionnaire respondent (that is, professional colleagues who responded to this baseline enquiry), hence generating a total hypothetical number of interactions of 3000 (30 QNR respondents x 100 interactions each). The graphic below shows the relative rankings of all 18 dimensions again, So for example, the mean average prevalence for the dimension 'students show evidence of having difficulty putting their writing ideas into a sensible order' is 75.7% based on the data collected from all respondents. This means that we might expect any one of our dyslexia support specialists to experience approximately 76 (independent) student interactions presenting this dimension out of every 100 student interactions in total. Scaled up as a proportion of the baseline 3000 interactions, this produces an expected number of interactions of 2271 presenting this dimension.
Complex and fiddly as this process may sound at first, it was found to be very useful for gaining a better understanding of what the data means. With hindsight, it may have enabled a clearer interpretation to have been made if the preamble to the questionnaire had very explicitly made clear that the interest was in independent student interactions to try to ensure that colleagues did not count the same student visiting on two separate occasions presenting the same dimension each time. It is acknowledged that this may be a limiting factor in the consistency of the data collected and mention of this has already been made above. We should note that this QNR has provided data about the prevalence of these 18 dimensions of dyslexia not from a self-reporting process amongst dyslexic students, but on the observation of these dimensions occurring in interactions between professional colleagues supporting dyslexia and the dyslexic students they are working with in HE institutions across the UK. The QNR did not ask respondents to state the number of interactions on which their estimates of the prevalence of dimensions were based over any particular time period, but based on how busy dyslexia support professionals in universities tend to be, it might be safe to assume that the total number of interactions on which respondents' estimates were based is likely to have been reasonable.
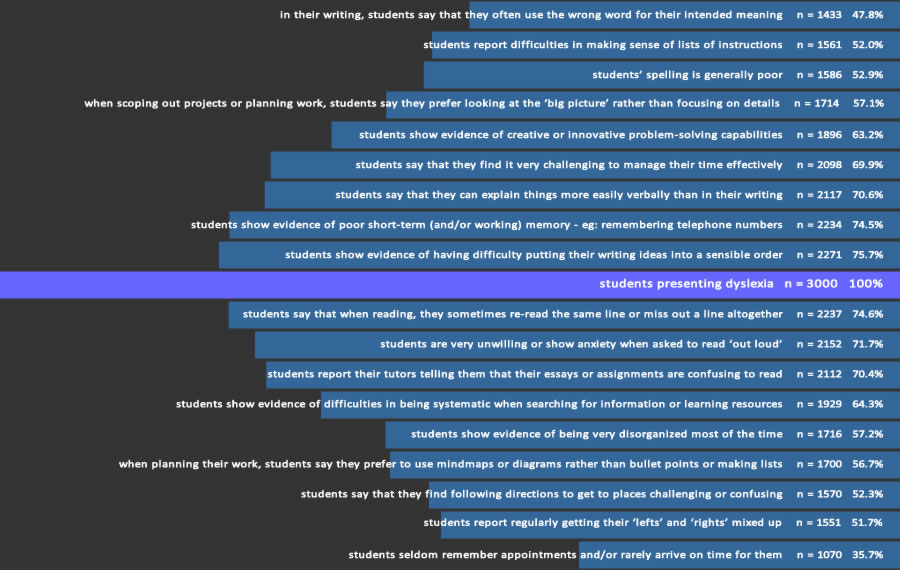
Another factor worthy of mention is that correlations between dimensions have been calculated to obtain Pearson Product-Moment Correlation Coefficient 'r' values. It was felt that by exploring these potential interlinking factors, more might be learnt about dimensions that are likely to be occurring together, which aside from being interesting in itself, understanding more about correlations between dimensions could, for example, be helpful for developing suggestions and guidelines for dyslexia support tutors working with their students. So far at least, no research evidence has been found that considers the inter-relationships between characteristics of dyslexia in university students and whether there is value in devising strategies to jointly remediate them during study-skills tutorial sessions.
Although at present, the coefficients have been calculated and scatter diagrams plotted to spot outliers and explore the impact that removing them has on r, a deeper investigation about what might be going on is another further development to be undertaken later. In the meantime, the full matrix of correlation coefficients together with their associated scatter diagrams is available on the project webpages here . Some of the linkages revealed do appear fascinating, for example, there appears to be a moderate positive correlation (r = 0.554) between students observed to be poor time-keepers and who also often get their 'lefts' and 'rights' mixed up; or that students who are reported to be poor at following directions to get to places appear to be observed as creative problem-solvers (r = 0.771). Some other inter-relationships are well-observed and unsurprising, for example, r = 0.601 for the dimensions relating to poor working memory and confused writing. Whilst it is fully understood thatcorrelation does not mean causation, nevertheless, time will be set aside to revisit this part of the data analysis as it is felt that there is plenty of understanding to be gained by exploring this facet of the enquiry more closely later.
Feeding these results into the construction of the Dx Profiler
In the main research questionnaire, the Dyslexia Index Profiler formed the final section. All 18 dimensions were included and were reworded slightly into 1st person statements. Respondents were requested to adjust the input-value slider to register their degree of acquiescence with each of the statements. The questionnaire's output submitted raw scores to the researcher in the form of an e-mail displaying data in the body of the e-mail but also as an attached .csv file. Responses were first collated into a spreadsheet which was used to aggregate them into a weighted mean average derived from the Preliminary Enquiry 2 as described above. Two additional dimensions were included to provide some detail about learning biography, one to gain a sense of how the respondent remembered difficulties they may have experienced in learning to read in early years, and the other about similar-letter displacement mistakes in their early writing:
- when I was learning to read at school, I often felt I was slower than others in my class
- In my writing at school, I often mixed up similar letters like 'b' and 'd' or 'p' and 'q'
It was felt that these two additional dimensions elicit a sufficient sense of early learning difficulties typically associated with the dyslexic child but which will, or are likely to have been mitigated in later years, especially amongst the population of more academically able adults who might be expected to be at university. These dimensions were not included in the baseline enquiry to dyslexia support professionals as it was felt that they would be unlikely to have knowledge about these aspects of a student's learning biography. The table below lists all 20 dimensions in the order and phraseology in which they were presented in the main research questionnaire, together with the weighting (w) assigned to each dimension's output value. It can be seen that the two additional dimensions were each weighted by a factor of 0.80 to acknowledge the strong association of these characteristics of learning challenges in early reading and writing with dyslexia biographies.
It should be noted, and in accordance with comments earlier, that some statements have also been reworded to provide a better balance overall between dimensions that imply negative characteristics and which might attract unreliable disaquiescence and those which are more positively worded. For example, the dimension explored in the baseline enquiry of: 'students' spelling is generally poor' is rephrased in the Dyslexia Index Profiler to: 'My spelling is generally good'. Given poor spelling to be a typical characteristic of dyslexia in early-years writing, it would be expected that although many dyslexic students at university have improved spelling, it remains a weakness and many rely on technology-associated spellcheckers for correct spellings.
| item # | item statement | weighting |
| 3.01 | When I was learning to read at school, I often felt I was slower than others in my class | 0.80 |
| 3.02 | My spelling is generally very good | 0.53 |
| 3.03 | I find it very challenging to manage my time efficiently | 0.70 |
| 3.04 | I can explain things to people much more easily verbally than in my writing | 0.71 |
| 3.05 | I think I am a highly organized learner | 0.43 |
| 3.06 | In my writing I frequently use the wrong word for my intended meaning | 0.48 |
| 3.07 | I generally remember appointments and arrive on time | 0.64 |
| 3.08 | When I'm reading, I sometimes read the same line again or miss out a line altogether | 0.75 |
| 3.09 | I have difficulty putting my writing ideas into a sensible order | 0.76 |
| 3.10 | In my writing at school, I often mixed up similar letters like 'b' and 'd' or 'p' and 'q' | 0.80 |
| 3.11 | When I'm planning my work I use diagrams or mindmaps rather than lists or bullet points | 0.57 |
| 3.12 | I'm hopeless at remembering things like telephone numbers | 0.75 |
| 3.13 | I find following directions to get to places quite straightforward | 0.48 |
| 3.14 | I prefer looking at the 'big picture' rather than focusing on the details | 0.57 |
| 3.15 | My friends say I often think in unusual or creative ways to solve problems | 0.63 |
| 3.16 | I find it really challenging to make sense of a list of instructions | 0.52 |
| 3.17 | I get my 'lefts' and 'rights' easily mixed up | 0.52 |
| 3.18 | My tutors often tell me that my essays or assignments are confusing to read | 0.70 |
| 3.19 | I get in a muddle when I'm searching for learning resources or information | 0.64 |
| 3.20 | I get really anxious if I'm asked to read 'out loud' | 0.72 |
However it is recognized that designing questionnaire items in such a way as to best ensure the strongest veracity in responses can be challenging. Setting aside design styles that seek to minimize random error, the research literature reviewed appears otherwise inconclusive about the cleanest methods to choose and, significantly, little research appears to have been conducted about the impact of potentially confounding, latent variables hidden in response styles that may be dependent on questionnaire formatting (Weijters, et al, 2004). Although only possible post-hoc, analysis measures such as Cronbach's α can at least provide some idea about a scale's internal consistency reliability although at the level of this research project, it has not been possible to consider the variability in values of Cronbach's α that may arise through gaining data from the same respondents but through different questionnaire styles, design or statement wording. Nevertheless, this 'unknown' is recognized as a potential limitation of the data collection process that must be mentioned and these aspects of questionnaire design will be expanded upon in more detail in the final thesis.
Reverse coding data
Having a balance of positively and negatively-phrased statements brings other issues, especially when the data collected is numerical in nature and aggregate summary values are calculated. For each of the dimension statements either a high score was expected, indicating strong agreement with the statement, or a low score, conversely indicating strong disagreement, to be a marker of a dyslexic profile. Since the scale is designed to provide a numerical indicator of a 'dyslexia-ness', it seemed appropriate to aggregate the input-values that were recorded by respondents in such a way that a high aggregated score points towards a strong dyslexic profile. It had been planned to reverse code scores for some statements so that the overall calculation to the final Dyslexia Index would not be upset by high and low scores cancelling each other out where a high score for one statement and a low score for a different statement were each indicating a dyslexic profile. Below is the complete list of 20 statements showing whether a 'high score=strong agreement (H)' or a 'low score=strong disagreement (L)' was expected to be the dyslexic marker.
Thus for the statement: 'my spelling is generally good' where it is widely acknowledged that individuals with dyslexia tend to be poor spellers, a low score indicating strong disagreement with the statement would be the marker for dyslexia and so respondent values for this statement would be reverse-coded when aggregated into the final Dyslexia Index. However the picture that emerged for many of the other statements once the data had been collated and tabulated was less clear. To explore this further a Pearson Product-Moment Correlation was run to calculate values for the correlation coefficient, r, for each statement with the final aggregated Dyslexia Index (Dx). Although it is accepted that this is a somewhat circular process, since all of the statements being correlated with Dx are each part of the aggregated score that creates Dx, it was felt that exploring this may still provide a clearer picture for deciding which statements' data values should be reverse-coded and which others should be left in their raw form. It has only been possible to apply this analysis once all data has arrived from the deployment of the main research questionnaire (May/June 2016). In total, 166 complete questionnaire replies were received or which 68 included a declaration that the respondent had a formally identified dyslexic learning difference.
These correlation coefficients are presented in the table below. The deciding criteria used was this: if the expectation is to reverse-code a statement's data and this is supported by a strong negative correlation coefficient, hence indicating that statement is negatively correlated with Dx, then the reverse-coding process would be applied to the data. If the correlation coefficient indicates anything else – that is ranging from weak negative to strong positive – the data would be left as it is. H/L indicates whether a High or a Low score is expected to be a marker for dyslexia and 'RC' indicates a statement that is to be reverse-coded as a result of considering r.
It can been seen from the summary table that the only dimension that has eventually been reverse-coded has been dimension #2: 'my spelling is generally very good' as this was the only one that presented a high(ish) negative correlation with Dx of r = - 0.52. It of note that of the other dimensions that were suspected to require reverse-coding, their correlations with Dx is close to zero which suggests that either reverse-coding or not will make little appreciable difference to the aggregated final Dyslexia Index.
With the complete datapool now established from the 166 main research questionnaire replies received, it has been possible to look more closely at correlation coefficient relationships between the dimensions. A commentary on this is posted on the project's StudyBlog (post title: 'reverse coding') and a deeper exploration of these relationships is part of the immediate development objectives of this part of the project. It of note though, that by also running a Student's t-test for identifying differences between independent samples' means (at the 0.05 critical level, one-tail test ), for the mean value of each of the 20 dimensions in the Dyslexia Index Profiler between the two primary research groups (respondents with declared dyslexia, effectively the 'control' group, n=68 and the remaining respondents, assumed to have no formally identified dyslexia, n = 98), significant differences between the means were identified for 16 out of the 20 dimensions. The 4 dimensions where no significant difference occurred between the dimensions' sample means were:
- I find it very challenging to manage my time effectively; (t = -1.1592, p = 0.113)
- I think I am a highly organized learner; (t = -0.363, p = 0.717)
- I generally remember appointments and arrive on time; (t = 0.816, p = 0.416)
- I find following directions to get to places quite straightforward; (t = 0.488, p = 0.626)
... which is suggesting that these four dimensions are having little or no impact on the overall value of the Dyslexia Index (Dx) and that therefore these dimensions might be omitted from the final aggregated score. In fact these same four dimensions were identified through the Cronbach's Alpha analysis as being possibly redundant items in the scale (details below). T-test results for all the other 16 dimensions produced p-value results at very close to zero indicating very highly significant differences for each dimensions' mean values between the control group of dyslexic students and everyone else. So as mentioned below, in the first-stage development of the Dyslexia Index Profiler, these four dimensions have been removed, leaving a 16-item scale. In addition, data from this reduced scale has now been used to recalculate each respondent's Dyslexia Index where this is being used as the key discriminator to identity students with a dyslexia-like profile but who are not known to be dyslexic, and hence, to enable research groups' academic behavioural confidence to be compared.
Internal consistency reliability - Cronbach's α
 It has also now been possible to assess the internal consistency reliability of the Dyslexia Index Profiler using the 166 datasets that have been received with the data collated into the software application SPSS.
Cronbach's Alpha (α) is widely used to establish the supposed internal reliability of data collection scales. It is important to take into account, however, that the coefficient is a measure for determining the extent to which scale items reflect the consistency of scores obtained in specific samples and does not assess the reliability of the scale per se (Boyle et al, 2015) because it is reporting a feature or property of the individuals' responses who have actually taken part in the questionnaire process. This means that although the alpha value provides some indication of internal consistency it is not necessarily evaluating the homogeneity, that is, the unidimensionality of a set of items that constitute a scale.
Nevertheless and with this caveat in mind, the Cronbach's Alpha process has been applied to the scales in the datasets collected from student responses to the main research questionnaire using the 'Scale-Analyse' feature in SPSS.
It has also now been possible to assess the internal consistency reliability of the Dyslexia Index Profiler using the 166 datasets that have been received with the data collated into the software application SPSS.
Cronbach's Alpha (α) is widely used to establish the supposed internal reliability of data collection scales. It is important to take into account, however, that the coefficient is a measure for determining the extent to which scale items reflect the consistency of scores obtained in specific samples and does not assess the reliability of the scale per se (Boyle et al, 2015) because it is reporting a feature or property of the individuals' responses who have actually taken part in the questionnaire process. This means that although the alpha value provides some indication of internal consistency it is not necessarily evaluating the homogeneity, that is, the unidimensionality of a set of items that constitute a scale.
Nevertheless and with this caveat in mind, the Cronbach's Alpha process has been applied to the scales in the datasets collected from student responses to the main research questionnaire using the 'Scale-Analyse' feature in SPSS.
The α value for the Dyslexia Index (Dx) 20-item scale computed to α = 0.852 which seems to be indicating a good level of internal consistency reliability. According to Kline (1986) an alpha value within the range 0.3 < α < 0.7 is to be sought, with preferred values being closest to the upper limit in this range. Kline proposed that a value of α < 0.3 is indicating that the internal consistency of the scale is fairly poor whilst a value of α > 0.7 may be indicating that the scale contains redundant items whose values are not providing much new information. It is encouraging to note that the same, four dimensions as identified and described in the section above did emerge as the most likely, 'redundant' scale items, hence further validating the development of the reduced, 16-item scale for Dyslexia Index, as reported above. Additionally, an interesting paper by Schmitt (1996) highlights research weaknesses that are exposed by relying on Cronbach's Alpha alone to inform the reliability of questionnaires' scales, proposing that additional evaluators about the inter-relatedness of scale items should also be reported, particularly, inter-correlations. SPSS has been used to generate the α value for the Dx scale and the extensive output window that accompanies the root value also presents a complete matrix of inter-correlations (below) and this connects well with mention above about exploring the correlation inter-relationships between each of the dimensions being gauged in the Dyslexia Index Profiler as a future development. [rollover a thumbnail image for reminder of the dimension; click a correlation co-efficient to view the corresponding scatter diagram; squares holding two correlation coefficient values display the value of r with outliers removed (and the original r-value), click to view the revised scatter diagram].
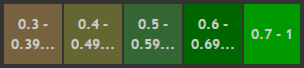


On the basis of Kline's guidelines, the value of α = 0.852, possibly showing a suspiciously high level of internal consistency and hence, some scale-item redundancy. SPSS is very helpful as one of the outputs it can generate shows how the alpha value would change if specific scale items are removed. Running this analysis showed that for any single scale item that is removed, the corresponding revised values of alpha fell within the range 0.833 < α < 0.863 which, quite confusingly, is quite a tight range of α values and might be suggesting that in fact, all scale items are making a good contribution to the complete 20 scale-item value of α. It is intended to explore all this in more detail, especially by using SPSS to remove all of the 4, apparently redundant items to observe the impact that this has on the value of Cronbach's α.
However, the matrix of inter-correlations for the metric Dx does present a wide range of correlation coefficients (above). These range from r = -0.446, between scale item statements: 'I think I'm a highly organized learner' and 'I find it very challenging to manage my time efficiently' – which might be expected; to r = 0.635, between scale item statements: 'I get really anxious if I'm asked to read 'out loud' ' and 'When I'm reading, I sometimes read the same line again or miss out a line altogether' – which we also might expect. This needs to be investigated in more detail and a likely course of action will be to apply a Principal Component Analysis to these correlations coefficients to explore how highly correlated scale items can be brought together into a series of factors. This is an immediate development task.
Reporting more than Cronbach's α
Further reading about internal consistency reliability coefficients has identified studies which firstly identify persistent weaknesses in the reporting of data reliability in research, particularly in the field of social sciences (eg Henson, 2001, Onwuegbuzie & Daniel, 2000, 2002). Secondly, useful frameworks are suggested for a better process for reporting and interpreting internal consistency reliability estimates which, it is argued, then present a more comprehensive picture of the reliability of data collection procedures, particularly data elicited through self-report questionnaires. Henson (op cit) strongly emphasizes the point that 'internal consistency coefficients are not direct measures of reliability, but rather are theoretical estimates derived from classical test theory' (2001, p177), which connects with Boyle's (2015, above) interpretation about the sense of this measure being relational to the sample from which the scale data is derived rather than directly indicative of the reliability of the scale more generally. However Boyle's view relating to the scale item homogeneity appears to be different from Henson's who, contrary to Boyle's argument, does state that internal consistency measures do indeed offer an insight into whether or not scale items are combining to measure the same construct. Henson strongly advocates that when (scale) item relationship correlations are of a high order, this indicates that the scale as a whole is gauging the construct of interest with some degree of consistency – that is, that the scores obtained from this sample at least, are reliable (Henson, 2001, p180). This apparent perversity is less than helpful and so in preparation for the final thesis of this research project, this difference of views needs to be more clearly understood and reported, a task that will be undertaken as part of the project write-up.
However at this stage, it has been found informative to follow some of these guidelines. Onwuegbuzie and Daniel (2002) base their paper on much of Henson's work but go further by presenting recommendations to researchers which proposes that they/we should always estimate and report:
- internal consistency reliability coefficients for the current sample;
- confidence intervals around internal consistency reliability coefficients – but specifically upper tail limit values;
- internal consistency reliability coefficients and the upper tail confidence value for each sample subgroup (ibid, p92)
The idea of providing a confidence interval for Cronbach's α is attractive, since, as being discussed here, we now know that the value of the coefficient is relating information about the internal consistency of scores for items making up a scale that pertains to that particular sample. Hence it then represents merely a point estimate of the likely internal consistency reliability of the scale, (and of course, the construct of interest), for all samples taken from the background population. But interval estimates are better, especially as the point estimate value, α, is claimed by Cronbach himself in his original paper (1951) to be most likely a lower-bound estimate of score consistency, implying that the traditionally calculated and reported single value of α is likely to be an under-estimate of the true internal consistency reliability of the scale were it to be applied to the background population. So Onwuegbuzie and Daniel's suggestion that one-sided confidence intervals (the upper bound) are reported in addition to the value of Cronbach's α is a good guide for more comprehensively reporting the internal consistency reliability of data because it is this value which is more likely to be close to the true value.
Calculating the upper-limit confidence value for Cronbach's α
Confidence intervals are most usually specified to provide an interval estimate for the population mean using sample data to do this by using a sample mean – which is a point estimate for the population mean – and building the confidence interval estimate based on the assumption that the background population follows the normal distribution. So it follows that any point estimate of a population parameter might also have a confidence interval estimate constructed around it provided we can accept the most underlying assumption that the distribution of the parameter is normal. For a correlation coefficient between two variables in a sample, this is a point estimate of the correlation coefficient between the two variables in the background population and if we took a separate sample from the population we might expect a different correlation coefficient to be produced although there is a good chance that it would be of a similar order. Hence a distribution of correlation coefficients would emerge, much akin to the distribution of sample means that constitutes the fundamental tenet of the Central Limit Theorem and which permits us to generate confidence intervals for a background population mean based on sample data.
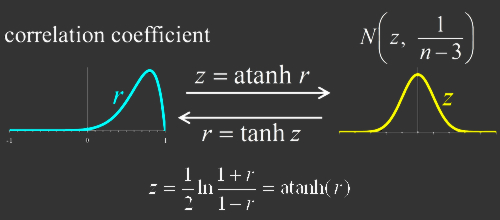 Fisher (1915) explored this idea to arrive at a transformation that maps the Pearson Product-Moment Correlation Coefficient, r , onto a value, Z’, which he showed to be approximately normally distributed and hence, confidence interval estimates could be constructed. Given that Cronbach’s α is essentially based on values of r, we can use Fisher’s Z’ to transform Cronbach’s α and subsequently apply the standard processes for creating our confidence interval estimates for the range of values of α we might expect in the background population. Fisher showed that the standard error of Z’, which is obviously required in the construction of confidence intervals, to be solely related to the sample size: SE = 1/√(n-3), with the transformation process for generating Z’ shown in the graphic (right).
So now the upper-tail 95% confidence interval limit can be generated for Cronbach alpha values and to do this, the step-by-step process described by Onwuegbuzie and Daniel (op cit) was worked through by following a useful example of the process outlined by Lane (2013):
- Transform the value for Cronbach's α to Fisher's Z'
- Calculate the Standard Error (SE) for Z'
- Calculate the upper 95% confidence limit for Z' + (SE)*Z [for the upper tail of 95% two-tail confidence interval, Z = 1.96]
- Transform the upper confidence limit for Z' back to a Cronbach's α internal consistency reliability coefficient.
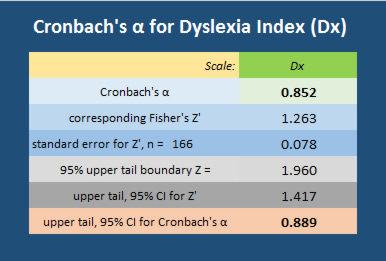 A number of online tools for transforming to Fisher's Z' were found but the preference has been to establish this independently in Excel using the z-function transformation shown in the graphic above. The table (right) shows the set of cell calculation step-results from the Excel spreadsheet and particularly, the result for the upper 95% confidence limit for α for the Dyslexia Index Profiler scale (α = 0.889).
So this completes the first part of Onwuegbuzie & Daniel's (2002) additional recommendation by reporting not only the internal reliability coefficient, α, for the Dyslexia Index Profiler scale, but also the upper tail boundary value for the 95% confidence interval for α.
A number of online tools for transforming to Fisher's Z' were found but the preference has been to establish this independently in Excel using the z-function transformation shown in the graphic above. The table (right) shows the set of cell calculation step-results from the Excel spreadsheet and particularly, the result for the upper 95% confidence limit for α for the Dyslexia Index Profiler scale (α = 0.889).
So this completes the first part of Onwuegbuzie & Daniel's (2002) additional recommendation by reporting not only the internal reliability coefficient, α, for the Dyslexia Index Profiler scale, but also the upper tail boundary value for the 95% confidence interval for α.
The second part of their suggested improved reporting of Cronbach's α requires the same parameters to be reported for the subgroups of the main research group. In this study the principle subgroups divide the complete datapool into student respondents who declared their existing identification of dyslexia and those others who indicated that they had no known learning challenges such as dyslexia. As detailed on the project's webpages , these research subgroups are designated research group DI (n = 66) and research group ND (n = 98) respectively. SPSS has then been used again to analyse scale reliability and the Excel spreadsheet calculator function has generated the upper tail 95% CI limit for α. Results are shown collectively in the table (right, and below).
These tables show the difference in the root values of α for each of the research subgroups: Dx - ND, α = 0.842; Dx - DI, α = 0.689. These are both 'respectable' values for Cronbach's α coefficient of internal consistency reliability although at the moment I cannot explain why the value of α = 0.852 for the complete research datapool is higher than either of these values, which is puzzling. This will be explored later and reported. However, it is clear to see that, assuming discrepancies are resolved with a satisfactory explanation, the upper tail confidence interval boundaries for not only the complete research group but also both subgroups all present an α value that indicates a strong degree of internal consistency reliability for the Dyslexia Index scale, notwithstanding Kline's earlier caveats mentioned above.
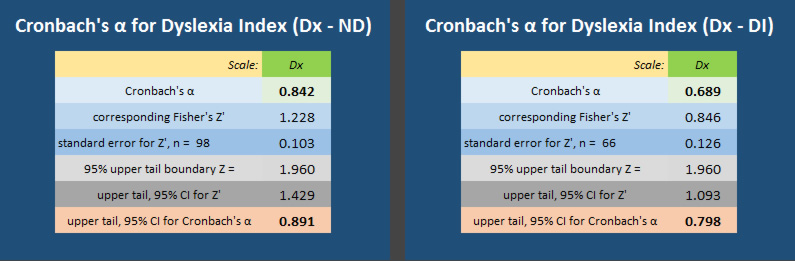
Preliminary data analysis outcomes
Following deployment of the main research questionnaire during the Summer Term 2016, 183 responses were received of which 17 were discarded because they were less than 50% completed or 'spoiled' in some other way. The remaining 166 datasets are collectively referred to as the datapool. Of the 166 'good' datasets, 68 were from students with dyslexia leaving a remainder of 98 from students who indicated no learning challenges (n = 81) or indicated a learning challenge other than dyslexia (n=17). The table below presents the initial results for the metric Dyslexia Index (Dx):
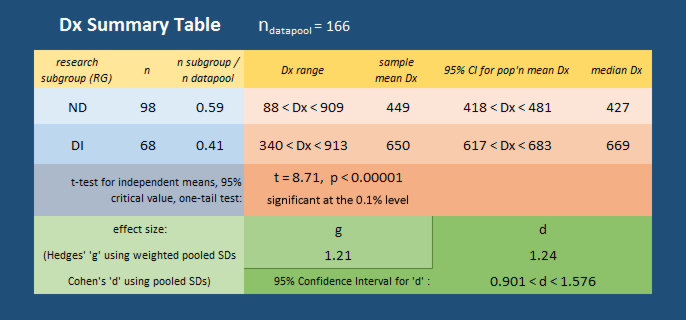
It can be seen that there are significant differences in Dx values for the two primary research subgroups, notably:
- both the sample mean Dx and median Dx for the subgroup ND are much lower than for the subgroup DI.
- Student's t-test for a difference between independent sample means was conducted on the complete series of datasets for each subgroup with the parameters set as a one-tail test - because the test was to see if the sample mean Dyslexia Index for students who offered no declaration of dyslexia is significantly lower than the sample mean Dx for students who were declaring dyslexia - and the test set at the conventional 95% critical value.
It can be seen that the resulting value of t = 8.71 generated a 'p' value of < 0.00001 which is indicating a level of significance that is off the scale. However, Levene's test for homogeneity of variances was violated (p = 0.009) although the alternative Welch's t-test, to be used when population variances are estimated to be different, returned t = 9.301, p < 0.00001 which is similarly indicating a significant difference between the mean values of Dx.
This was the expected result and on this judgment at least, appears to be indicating that the Dyslexia Index metric is clearly identifying dyslexia, at least according to the criteria applied in this project. - Additionally, the Hedges' 'g' effect size result of g = 1.21 is indicating a large to very large effect size for the sample means (Sullivan & Feinn, 2012). Hedges' 'g' is preferred as although it is based on Cohen's 'd', its calculation uses a weighted, pooled standard deviation based on the sample sizes which is considered to be better when the sample sizes are not close.
- Cohen's 'd' effect size is also calculated as it is possible to create a confidence interval estimate for the Cohen's 'd' effect size for the population (Cumming, 2010), so together with Hedges' 'g', these are also indicating that there is a strong liklihood of significant differences between the Dyslexia Index of students with reported dyslexia and those without. Thus for the purposes of this research project, the Dyslexia Index Profiler is a good discriminator.
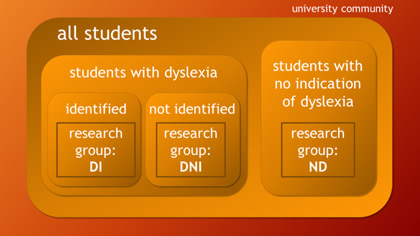 The Dyslexia Index Profiler has been developed to enable discrimination to be applied within the research group ND data to search for QNR respondents who appear to be presenting an unidentified dyslexic profile. This is a key process of the whole research project as it subsequently establishes a fresh research sub-group, designated research group 'DNI', of students with dyslexic-like profiles but who are not formally identified as dyslexic. Clearly the summary table above appears to be indicating that there are students with a high Dx value in the non-dyslexic subgroup, ND, which is exactly what the profiler set out to establish.
So the complete datapool can now be sub-divided further into three research subgroups:
The Dyslexia Index Profiler has been developed to enable discrimination to be applied within the research group ND data to search for QNR respondents who appear to be presenting an unidentified dyslexic profile. This is a key process of the whole research project as it subsequently establishes a fresh research sub-group, designated research group 'DNI', of students with dyslexic-like profiles but who are not formally identified as dyslexic. Clearly the summary table above appears to be indicating that there are students with a high Dx value in the non-dyslexic subgroup, ND, which is exactly what the profiler set out to establish.
So the complete datapool can now be sub-divided further into three research subgroups:
- Research group: DI - these are students who have declared in their questionnaire responses that they have an identified dyslexic learning difference.
- Research group: ND - these are students who have not declared that they have an identified dyslexic learning difference and who have indicated that they have no other learning challenges or they have chosen some other learning challenge from a list (eg: 'ADHD', 'dyspraxia', 'something else').
- Research subgroup DNI - this is a subgroup of students from research group ND who have been filtered out using the Dyslexia Index Profiler and is the research group of particular interest to the project.
Labelling research groups can get confusing, as in this project, filtering processes are used to group datasets into subgroups. Although it is recognized that the main groups of interest, that is students with identified dyslexia (DI) and students without (ND) are actually sub-groups of the complete datapool of all students, so as to avoid speaking of sub-sub-groups, the two principal subgroups, DI and ND, will be referred to simply as research groups so that subgroups of these can be more easily designated.
Setting boundary values for Dx
The next task has been to decide on a boundary value for Dyslexia Index in research group ND that acts to filter out student responses in this group into the subgroup DNI. As the data analysis process has progressed, a critical evaluation of the setting of boundary values has been applied. At the outset a cursory inspection of the data suggested that setting Dx = 600 as the filter seemed appropriate. Doing so generated a dataset subgroup of n=17 respondents with no previously reported dyslexia but who appeared to be presenting dyslexia-like characteristics in their study profiles. Although this generated a subgroup of small sample size which it is acknowledged, does impact on statistical processes that are applied, this sample subgroup DNI (n=18) does represent a sizeable minority of the background sample group ND (n=98) from which it is derived. In other words, it is indicating that nearly 20% of the non-dyslexic students who participated in the research appear to be presenting unidentified dyslexia-like profiles which is consistent with widely reported research suggesting that the proportion of known dyslexics studying at university is likely to be significantly lower than the true number of students with dyslexia or dyslexia-like study characteristics (eg: Richardson & Wydell, 2003, MacCullagh et al, 2016, Henderson, 2017). Equally, setting a lower boundary value of Dx = 400 has been useful for establishing an additional comparator subgroup of students from research group ND who are highly unlikely to be presenting unidentified dyslexia - this subgroup designated: ND-400. Although subsequently adjusted (see below) the opening analysis rationale for setting these boundary values has been:
| Research Group | Research SubGroup | Criteria |
| ND | ND-400 | students in research group ND who present a Dyslexia Index (Dx) of Dx < 400 |
| DNI | students in research group ND who present a Dyslexia Index of Dx > 600 - this is the group of greatest interest | |
| DI | DI-600 | students in research group DI who present a Dyslexia Index of Dx > 600 - this is the 'control' group |
The graphic below supports these boundary value conditions by presenting the basic statistics for each of the research groups and subgroups including confidence interval estimates for the respective population mean Dx values. On this basis it was felt that setting Dx filters at Dx = 400 and Dx = 600 were reasonable. Note particularly the lower, 99% confidence interval boundary for the population mean Dx for students with identified dyslexia falls at Dx = 606, and respective 99% lower CI boundary for students with no previously reported dyslexia falls at Dx = 408. (Note that research subgroup DNI, as established from these criteria, is not shown in this graphic but this group presented a mean Dx = 690, and 99% CI for μ of 643 < Dx < 737).
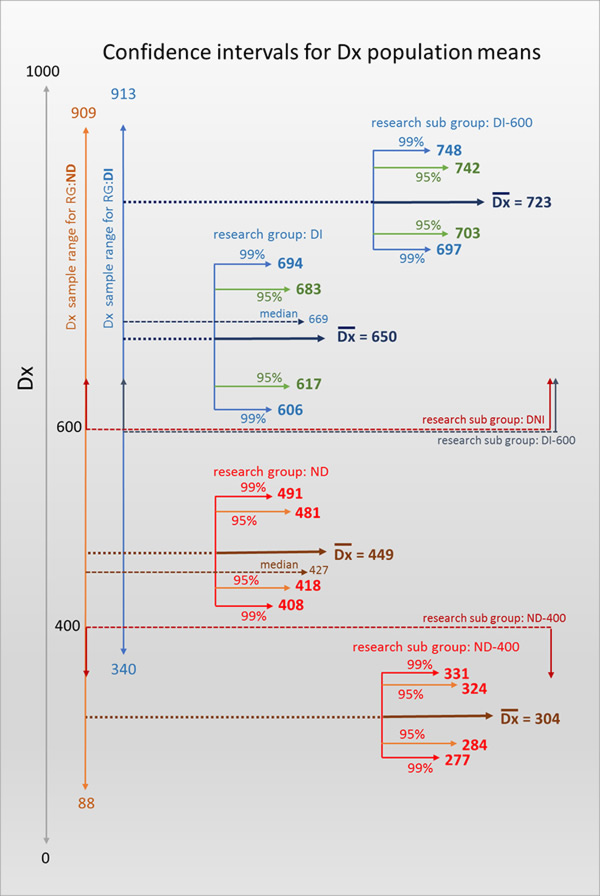
However, in order for the Academic Behavioural Confidence for the subgroups to be justifiably compared, particularly ABC values for the subgroups of students with identified dyslexia from the dyslexic group presenting Dx > 600, and students presenting dyslexia-like profiles from the non-dyslexic group by virtue their Dyslexia Index values also being Dx > 600, it is important for the key parameter of Dyslexia Index for each of these two subgroups to be close enough for us to be able to say, statistically at least, that the mean Dyslexia Index for the two groups is the same. Hence with research subgroup DNI presenting a mean Dx = 690, some 33 Dx points below the mean for research subgroup DI-600, it was felt necessary to conduct a t-test for independent sample means to establish whether this sample mean Dx = 690 is significantly different from the sample mean Dx = 723 for research subgroup DI-600. If not, then the boundary value of Dx = 600 remains a sensible one for sifting respondents into research subgroup DNI, however if there is a significant difference between these sample means then this is suggesting that the two subgroups are not sharing the similar (background population) characteristic of mean Dx and hence other comparison analysis of attributes between these two research subgroups could not be considered so robustly.
Thus conducting a Student’s t-test for independent sample means, set at the conventional 5% level and as a one-tail test because it is known that the sample mean for research subgroup DI-600 is higher rather than merely different from that for research subgroup DNI, the outcome returned values of t = 1.6853, p = 0.0486 (calculation source here) indicating that there is a significant difference between the sample means of the two research subgroups, albeit only just. Following several further iterations of the t-test based on selecting different boundary Dx values close to Dx = 600, an outcome that is considered satisfactory has been established using a boundary value of Dx = 592.5. This returned a t-test result of t = 1.6423, p = 0.05275 which now suggests no statistically significant difference between the sample means, although again, this p-value is only just above ‘not significant’ boundary value of the test.
The impact of this adjustment has been to increase the sample sizes of research subgroup DNI from n=17 to n=18, and of research subgroup DI-600 from n = 45 to n = 47 due to a slight shift in the datasets now included in the fresh groupings. Note too, the small differences in the means and CIs for these two research subgroups which is due to the revised sample sizes. The graphic below reflects all of these small differences and we can now clearly identify all of the research subgroups that will be discussed throughout the remainder of the thesis:
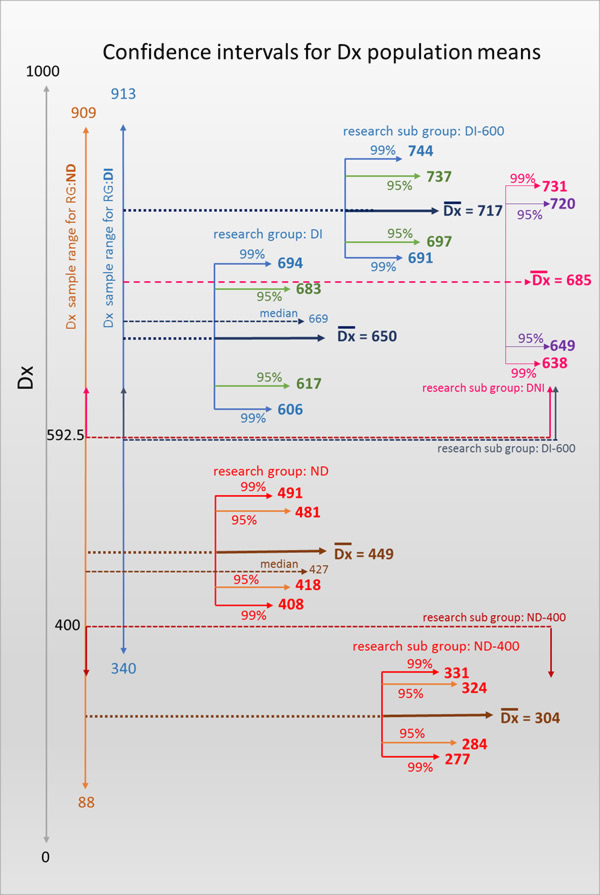
In order to avoid labelling confusion it is felt that although the most important Dx boundary value has shifted to Dx = 592.5, research subgroup designations will remain annotated as '##600'. The summary table (below) sets out all of the research subgroups and their designations including additional minor subgroups that will be referred to occassionally throughout the discussion section of the final thesis. It is important to reiterate that the principal Academic Behavioural Confidence comparison will be between research subgroups ND-400, DNI and DI-600.
| Research Group | Research SubGroup (n) | Criteria |
| ND | ND-400 (44) | students in research group ND who present a Dyslexia Index (Dx) of Dx < 400 |
| NDx400 (36) | students in research group ND who present a Dyslexia Index (Dx ) of 400 < Dx < 592.5 | |
| DNI (18) | students in research group ND who present a Dyslexia Index of Dx > 592.5 - this is the group of greatest interest | |
| DI | DI-600 (47) | students in research group DI who present a Dyslexia Index of Dx > 592.5 - this is the 'control' group |
| DIx600 (19) | students in research group DI who present a Dyslexia Index of 400 < Dx < 592.5 | |
Close inspection of the datasets however, also revealed a number of students in research group ND who presented a Dyslexia Index of between Dx = 400 and Dx = 592.5 which is interesting because these respondents are presenting what appears to be a kind of 'partial' dyslexia. This research subgroup is designated NDx400 (n = 36). This is interesting when taken with the 18 of the 68 students in research group DI - the students who had declared their dyslexia - who also returned a Dx value of between 400 and 592.5 (n = 19). Only two respondents in research group DI returned Dx values of Dx < 400 (339.92, 376.31) and these will be considered as outliers. But it was felt that this 'grey' group of apparently partial dyslexics, both previously identified, and not, deserve more scrutiny to see if other characteristics identified from scores in the other metrics in this project are also shared or whether other interesting differences emerge. This is will be part of the deeper analysis of the data in due course and fully reported in the final thesis.
RELATING DYSLEXIA INDEX (Dx) TO ACADEMIC BEHAVIOURAL CONFIDENCE (ABC)

Preliminary report
According to the data analysis conducted to date (Nov 2016), linkages are emerging between the metrics Dyslexia Index (Dx) and Academic Behavioural Confidence (ABC) - which is, of course, the focus of the research.
To recap: the hypothesis being tested is that students with an unidentified dyslexia-like profile return a higher ABC than their dyslexia-identified peers. This may then be evidence that their general academic agency may also be at a higher level. Hence, this conclusion supports the suggestion that it may be more appropriate not to label students with dyslexia as to do so, may burden them with an additional and possibly unnecessary learning challenge to overcome. However there is a good deal more to be done in unpicking both the quantitative data that has been collected and not least, the rich qualitative responses that many students have provided and so these conclusions are at best, tentative at the moment.
However in summary to date, it is useful to be able to report that a medium effect size of 0.503 has been found between the ABC of students in research subgroup DI-600 (RG:DI-600) and research subgroup DNI (RG:DNI), which is supported by values in Student's t-test of p = 0.041 (t = 1.769, 5% level, one-tail test) which is indicating that the sample mean ABC for RG:DI-600 is significantly higher than the sample mean of RG:DNI. At this stage, Sander & Sanders' (2006) original 24-item scale for ABC has been used to generate these results. This is summarized in the table below. However their further research into academic behavioural confidence through factor analysis led to a reduced, 17-item scale with four factors being identified: grades, verbalizing, study, and attendance (Sander, 2009). In applying this reduced item scale to the data collected in my research, marginally different overall results were generated. Much greater variance was identified when the data was analysed on a factor by factor basis however and this will be interpreted and properly reported in due course.
| ABC(24) effect size between research subgroups ## <-> ## | Hedges 'g' | Cohen's 'd' | CI for Cohen's 'd' | t-test; t = | t-test; p = | significance |
| DI-600 < - > DNI | 0.503 | 0.561 | -0.008 < d < 1.126 | 1.769 | 0.041 | p < 0.05; sig at 5% level |
| DI-600 < - > ND-400 | 1.068 | 1.069 | 0.622 < d < 1.511 | 5.037 | < 0.00001 | off the scale |
| ABC(17) effect size between research subgroups ## <-> ## | ||||||
| DI-600 < - > DNI | 0.534 | 0.561 | -0.008 < d < 1.126 | 1.877 | 0.033 | p < 0.05; sig at 5% level |
| DI-600 < - > ND-400 | 1.088 | 1.069 |
0.639 < d < 1.531 | 5.129 | <0.00001 | equally off the scale |
These data point in the right direction for supporting the research hypothesis. In using the ABC(24-factor) and the ABC(17-factor) results both present an effect size of g > 0.5, thus on the strong side of 'medium', with both supported by the outcome of Students' t-tests indicating a significantly higher ABC for students with unidentified dyslexia-like profiles in comparison with that for known dyslexics. Outwardly, this is suggesting, as predicted in the research outline and design, that for students already studying at university but who appear to be presenting dyslexia-like study attributes and profiles it may be advisable for them to remain un-referred to university Dyslexia Support Services and hence not to proceed through dyslexia screening processes but rather they should be left to tackle their studies as best they can. A deeper discussion will be presented in the final thesis.
Concluding remarks
There is no doubt that as the project has evolved, aspects have emerged that were not foreseen at the outset – indeed the development of the Dyslexia Index Profiler was conceived later in the research design planning and intended to be a metric to merely support the original rationale for the psychosocial profile charts to be the principle discriminator for establishing unidentified dyslexia. (These are all available on the project webpages here). As it has turned out, creating this fresh metric for assessing dyslexia-like attributes in university students and exploring the data that it has generated has taken precedent in the early stages of the analysis of the complete datapool of information returned through the questionnaire. This analysis has generated preliminary results which appear to be supporting the Dyslexia Index Profiler as an effective discriminator for identifying dyslexia-like study attributes and characteristics, and has resulted in an analysis outcome (to date) which is supporting the original research hypothesis.
In the intervening period from now until thesis submission, clearly a deeper analysis of the data is called for and will be conducted so that the final discussion section of the thesis will be able to accurately report the findings and draw out some conclusions and recommendations for further research. It is felt that at this stage, a deeper scrutiny of the other metrics that have been collected through the research questionnaire are best left for post-doctoral study, as is a more detailed analysis of the meaning that is being presented in the profile charts. Additionally, wide-ranging qualitative data has also been collected and this too will require collation and analysis later. It is hoped that much of this later work will feature in publications.
| REFERENCES: Ackerman, B.P., Izard, C.E., Kobak, R., Brown, E.D., Smith, C., 2007, Relation between reading problems and internalizing behaviour for preadolescent children from economically disadvantaged families, Child Development, 78(2), 581-596. |
||
| +44 (0)79 26 17 20 26 | www.ad1281.uk | ad1281@live.mdx.ac.uk | This page last edited: March 2017 |