
- When I was learning to read at school, I often felt I was slower than others in my class;
- My spelling is generally good;
- I find it very challenging to manage my time efficiently;
- I can explain things to people much more easily verbally than in my writing;
- I think I'm a highly organized learner;
- In my writing, I frequently use the wrong word for my intended meaning;
- I generally remember appointments and arrive on time;
- When I'm reading, I sometimes read the same line again or miss out a line altogether;
- I have difficulty putting my writing ideas into a sensible order;
- In my writing at school, I often mixed up similar letters like 'b' and 'd' or 'p' and 'q';
- When I'm planning my work I use diagrams or mindmaps rather than lists or bullet points;
- I'm hopeless at remembering things like telephone numbers;
- I find following directions to get to places quite straightforward;
- I prefer looking at the 'big picture' rather than focusing on the details;
- My friends say I often think in unusual or creative ways to solve problems;
- I find it really challenging to make sense of a list of instructions;
- I get my 'lefts' and 'rights' easily mixed up;
- My tutors often tell me that my essays or assignments are confusing to read;
- I get in a muddle when I'm searching for learning resources or information;
- I get really anxious if I'm asked to read 'out loud'.
project outline | design | post-project
discourse study-blog | resources | lit review maps | profiles
enquiry dysdefs QNR | dysdims QNR | research QNR
thesis overview | literature | research design | analysis & discussion | closing reflections
discourse study-blog | resources | lit review maps | profiles
enquiry dysdefs QNR | dysdims QNR | research QNR
thesis overview | literature | research design | analysis & discussion | closing reflections
 Draft (2017-18)
Academic confidence and dyslexia at university

Analysis and Discussion
This section presents the data analysis of the information acquired through the research questionnaire together with a continuous discussion about the outcomes.
The first part presents an overview of the demographics of the datapool showing the distribution of research participants by gender; study level, ranging from access or foundation year students through to post-doctoral researchers; study status, being either home or overseas students; and finally, dyslexia disclosure and how these participants learned of their dyslexia. Commentary will be included that interprets these data in comparison to national statistics relating to students in Higher Education in the UK and also key points which emerge will be related to others' research and the underlying theory. This narrative process will continue throughout this section with the most pertinent discussion points being extracted and reviewed in the Discussion section of the thesis which follows.
This opening section is followed by a general desription of the statistical tools and processes that have been used to explore the data and the rationales that shaped the analysis. The next sections present in turn, details of the mechanisms that were employed to extract meaning from the data collected through the Dyslexia Index (Dx) Profiler section of the questionnaire and through the Academic Behavioural Confidence Scale. Following this, a detailed section presents the findings that emerged from analysis of the inter-relationships between Dyslexia Index and Academic Behavioural Confidence overall, but also how these metrics were more deeply explored through Principal Component Analysis and hence what this revealed when looking at a factors of Dyslexia and of Academic Behavioural Confidence presented as a matrix of inter-relationships.
Lastly, a short section will briefly discuss the data retrieved from the other metrics in the research questionnaire - that of the 6, psychometric subscales, explaining why this is not included in the data analysis at this time and how this data might be explored as part of a future research project. [possibly delete this short para?]
The Analysis and Discussion section concludes with a summary of the most important findings with interpretations about what they are revealing in terms of the relationships between dyslexia and academic confidence in university students and why this is important to understand. [377/ #]
Complete Thesis Contents
- ABSTRACT
- ACKNOWLEDGEMENTS
- PROJECT OVERVIEW
- RESEARCH QUESTIONS
- STANCE
- RESEARCH IMPORTANCE
-
 THEORETICAL PERSPECTIVES
-
 DYSLEXIA
- A complex phenomenon or a psuedo-science?
- Dyslexia: the definition issues
- Dyslexia as a multifactoral difference
- Disability, deficity, difficulty, difference or none of these?
- Labels, categories, dilemmas of difference, inclusivity
- Impact of the process of identification
- To Identify or Not To Identify? - that is the question
- Measuring dyslexia - "how dyslexic am I?"
- ACADEMIC CONFIDENCE - theoretical foundations of the construct
- ACADEMIC SELF-EFFICACY - the parent construct for academic confidence
- The construct of academic self-efficacy
- The relationships between academic self-efficacy and academic achievement
- Confidence as a learning attribute
- The location of academic confidence within the construct of academic self-efficacy
- Academic Behavoural Confidence
- Use of the ABC scale in this research project
-
- RESEARCH DESIGN
- RESULTS, ANALYSIS and DISCUSSION
- LIMITATIONS
- CONCLUSIONS
- DIRECTIONS FOR FUTURE RESEARCH
- REFERENCES
- APPENDICES
Analysis and Discussion
Analysis and Discussion Section Contents:
- OVERVIEW
- TERMINOLOGY
- Research Questions
- ANALYSIS OUTCOME SUMMARY
- DATA ANALYSIS REPORT
- DEMOGRAPHICS
- HOW DYSLEXIC STUDENTS LEARNED OF THEIR DYSLEXIA
- The impact of receiving a diagnosis of dyslexia on Academic Behavioural Confidence
- DYSLEXIA INDEX
(Dx)
- Preliminary data anlsysis outcomes - descriptive statistics
- Setting boundary values for Dx
- PRINCIPAL COMPONENT ANALYSIS(PCA)
- Applying PCA to the datapool
- Factorial Analysis of Dyslexia Index (Dx)
- The primary PCA on Dyslexia Index
- Dyslexia Index Factors by Research Subgroup
- Comparing differences in Dyslexia Index dimensions between research subgroups
- Factorial Analysis of Academic Behavioural Confidence (ABC)
- Dx Factor x ABC Factor MATRIX
- Effect size between Academic Behavioural Confidence
- Key outcomes
- Applying multiple regression analysis
- Analysis summary and discussion
Overview
Data was acquired from the deployment of an electronic questionnaire across the student community at Middlesex University both through an invitation-to-participate to all university students published on the university's 'home' internal webpage and also through a targeted invitation-to-participate to the specific cohort of students registered with the university's Disability and Dyslexia Service.
On completion of the questionnaire, submitting it generated an e-mail containing the complete dataset which was sent to the researcher's university e-mail account. In total, 183 replies were received of which only 17 were discarded either because the questionnaire was less than 50% completed, or spoiled in some other way. Hence this provided a participant datapool of 166 complete datasets.
As reported in an earlier section, the questionnaire was very carefully designed to be an appealing, interactive, self-report webpage which incorporated innovative features that were intended to ensure that participant interest and hence engagement would be maintained throughout. The structure was divided into 5 sections which were accessed and viewable in turn, a design feature intended to reduce possible effects of questionnaire fatigue which might otherwise have occured should partipants have had sight of the complete questionnaire and hence perceive it to be lengthy and complex. This design approach, together with careful attention being paid to colours, contrasts and fonts, was adopted to try to ensure that the questionnaire was as accessible and dyslexia-friendly as possible, whilst at the same time retain a visual appeal and an innovative design so as to be interesting and attractive to all research participants.
The opening section collected demographic data relating to gender, known learning challenges, student resident category and study status. Participants recorded their answers using selections from drop-down menu lists or selecting from check-box items. An important part of this first part of the research questionnaire focused on participants who acknowledged their dyslexia by requesting these students to indicate how they learned of their circumstance. To do this, participants used a two drop-down menu lists of options to complete a simple sentence which then indicated how they learned about their dyslexia. It was assumed that this disclosure would have been through one of the formalized methods of dyslexia assessment either conducted with adult students at university or prior to commencing their courses.
The section which followed presented the Academic Behavioural Confidence Scale (Sander & Sanders, 2003, 2006, 2009) in its complete, 24-scale-item format with stem items unabridged nor modified in any way. Participants registered 'how confident they were that they will be able to ...' using an innovative sliding scale ranging from 0% to 100% (confident), hence replacing the conventional, 5-anchor-point Likert scale item recording process adopted in every other deployment of the Academic Behavioural Confidence Scale in research studies and projects to date. The rationale for this design approach has been discussed in the previous, Research Design, section.
On completion of the ABC Scale, participants were requested to work through the next section of 36 stem-item statements which were measuring the 6 psychometric scales of Learning Related Emotions, Anxiety regulation and Motivation, Academic self-efficacy, Self-esteem, Learned Helplessness, and Academic Procrastination. Each scale comprised 6 stem-item statements and participants also recorded their answers using continuous-scale sliders with end points of 0% and 100% agreement respectively. The detailed reporting of results recorded in this section and the subsequent analysis has been excluded from this thesis firstly because it became clear as a result of an early inspection and outline analysis of the complete datapool that sufficient data had been acquired through the ABC Scale and the Dyslexia Index Profiler to address the research hypotheses, and secondly that to include sufficient background literature review and later data analysis would have generated a finished thesis in excess of submission limitations. Hence data collected in this section has been saved for later use in a subsequent research project.
The final section of the questionnaire to collect quantitative data presented the 20-point Dyslexia Index Profiler and the now-familiar continuous-scale sliders were presented to partipants for recording their % agreement with each of the stem-item statements.
Lastly, participants were invited to qualify or enhance the data they had provided by writing in an unlimited free-text area anything else about their learning challenges or strengths, or any other aspects about how they approached their studies at university. Entering data into this section was optional.
[717/ # ]
Terminology
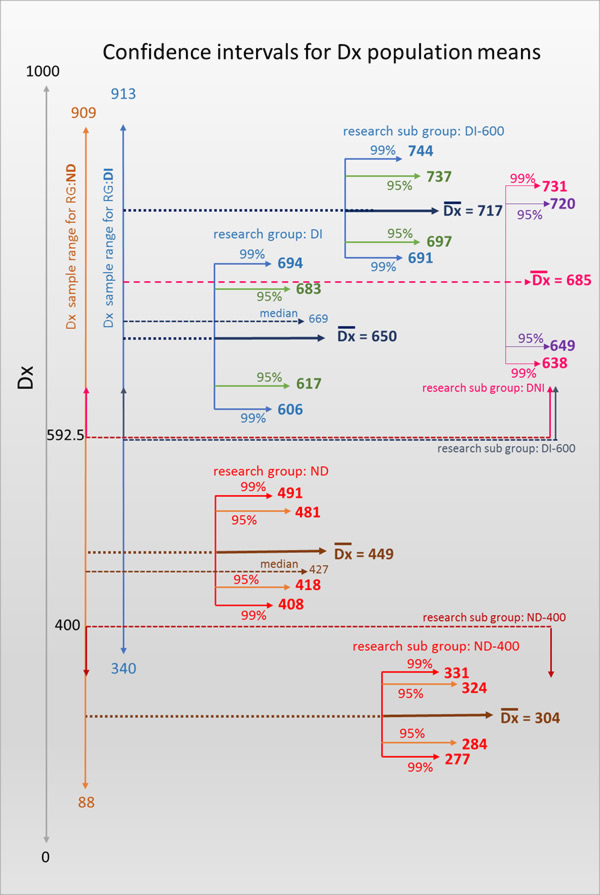
 The meanings of labels, terms, acronyms and designations used in the reporting and discussion of the data, results and analysis is presented in the table below where it is particularly important to note the designations assigned to research groups and subgroups. Within the complete datapool there are two, distinct research groups: students who acknowledged their dyslexia by indicating this on the questionnaire that they submitted; and students who alternatively indicated that they did not have any specific learning challenges that they knew about. Within each of these groups participants were sifted into subsets determined by the Dyslexia Index (Dx) value generated by their responses to that section of the questionnaire. The boundary value was set at Dx = 592.5. The rationale and justification for setting the boundary value at this point has been explained in the previous, Research Design section of this thesis (here). Students who had declared their dyslexia and whose Dyslexia Index value was above the boundary value, that is, Dx > 592.5, formed the CONTROL subgroup (i.e. subset) and students who had indicated no awareness of any specific learning challenges and whose Dyslexia Index was Dx > 592.5 formed the TEST subgroup. A further subgroup of students was established as a distinct subset of the group of participants who indicated no specific learning challenges where these participants presented a Dyslexia Index Dx < 400, that is, students indicating a very low level of dyslexia-ness. This subgroup is referred to as the BASE subgroup.
| TERM | abbreviation | MEANING |
| datapool | the complete set of data acquired from all the participant questionnaires included in the project; n = 166 | |
| dataset | the complete set of data provided by one participant | |
| research group | RG | a subgroup of the complete dataset |
| research group ND | RG:ND | the subset of the dataset containing participants who returned a disclosure of no specific learning challenges known; n = 98 |
| research group DI | RG:DI | the subset of the dataset containing participants who indicated that they were dyslexic; n = 68 |
| Dyslexia Index | Dx | the value returned by the Dyslexia Index Profiler section of the main questionnaire. Dyslexia Index falls within the range 0 to 1000 with a higher score indicating a higher level of dyslexia-ness. |
| research subgroup DNI | RG:DNI | the subset of research group ND containing participants who returned a Dyslexia Index of Dx > 592.5 - this is the group of participants who returned no disclosure of dyslexia but whose Dyslexia Index suggests a high level of dyslexia-ness - hence these are the participants of greatest interest in this project -this is the TEST GROUP |
| research subgroup DI-600 | RG:DI-600 | the subset of research group DI containing dyslexic participants who returned a Dyslexia Index of Dx > 592.5 - this is the CONTROL GROUP |
| research subgroup ND-400 | RG:ND-400 | the subset of research group ND containing participants who returned a Dyslexia Index of Dx < 400. This is the BASE GROUP |
| boundary value | this refers to the Dyslexia Index value which set the upper or lower Dx limit for determining a research subgroup. A report on how these values were established is provided in the previous section, Research Design. | |
| Academic Behavioural Confidence | ABC | the value returned by the Academic Behavioural Confidence Scale section of the main questionnaire, falling within the range 0 to 100 |
| ABC24 | referring to the complete, original Academic Behavioural Confidence Scale of 24 scale items | |
| ABC24-# | referring to one of the five factors of the Academic Behavioural Confidence 24-item Scale, determined in this study through factor analysis; # = 1,2,3,4,5 | |
| ABC17 | referring to the reduced, 17-scale item ABC Scale | |
| Principal Component Analysis | PCA | the method of dimension reduction analysis used to establish the five factors of ABC and the five factors of Dyslexia Index in this project |
Research questions and null hypotheses:
 Recall the research questions that this project is addressing:
- Do university students who know about their dyslexia present a significantly lower academic confidence than their non-dyslexic peers?
- Ho(1) = There is no difference between dyslexic and non-dyslexic students' levels of academic confidence;
- AH (1) = Non-dyslexic students present a higher level of academic confidence than their dyslexic peers.
If so, can particular factors in their dyslexia be identified as those most likely to account for the differences in academic confidence and are these factors absent or less-significantly impacting in non-dyslexic students?
- Do university students with no formally identified dyslexia but who show evidence of a dyslexia-like learning and study profile (i.e. quasi-dyslexic) present a significantly higher academic confidence than their dyslexia-identified peers?
- Ho(2) = There is no difference between dyslexic and apparently dyslexic students' levels of academic confidence;
- AH (2) = Quasi-dyslexic students present a higher level of academic confidence than their dyslexic peers.
If so, are the factors identified above in the profiles of dyslexic students absent or less-significantly impacting in students with dyslexia-like profiles?
Analysis outcome summary:
Thus the analysis of the data is in two stages: firstly it will be established that the Dyslexia Index Profiler is a sufficiently robust discriminator of dyslexia-ness to enable it to sift student research participants into the respective research groups and subgroups set out in the research design; and secondly the levels of Academic Behavioural Confidence between the groups and subgroups will be compared.
Hence the hypotheses of this research project can be properly addressed, which is to initially establish that dyslexic students at university present a lower level of academic confidence, as indicated using the standardized, Academic Behavioural Confidence Scale, than their non-dyslexic peers. To enable this, data from participants in the CONTROL group, RG:DI-600, will be compared with data from participants in the BASE group, RG:ND-400.
Secondly it will be established that students with previously unidentified, dyslexia-like study profiles, as indicated through use of the Dyslexia Index Profiler to evaluate their level of dyslexia-ness (Dx), present a higher level of academic confidence, as indicated using the ABC Scale, than their dyslexia-identified peers; data from participants in the TEST subgroup, RG:DNI will be compared with data in the CONTROL subgroup, RG:DI-600.
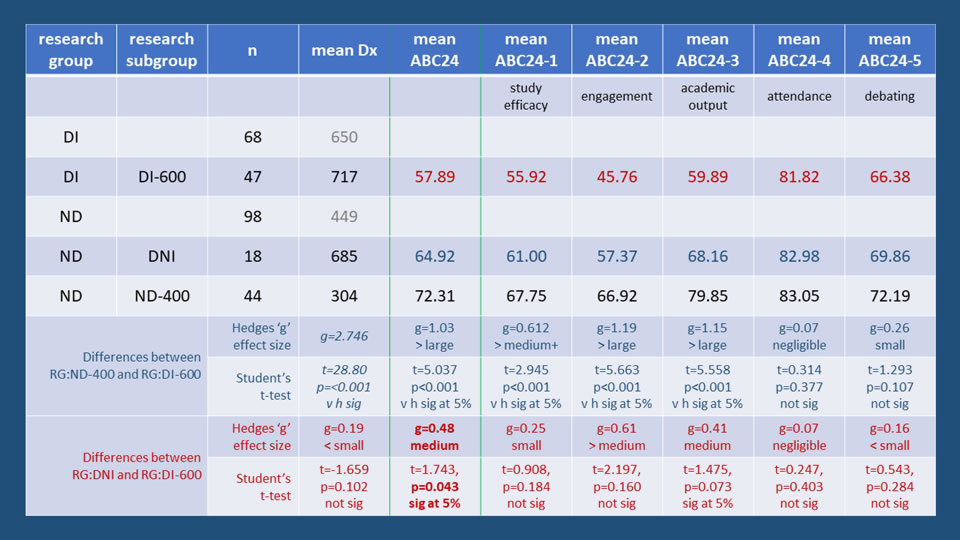
The summary table below presents a results overview for the data analysis conducted. It shows the mean Dx value for the two, principal research groups, DI, ND, and for the research subgroups, DNI, DI-600 and ND-400, representing respectively the TEST group, the CONTROL group and the BASE group, together with the corresponding mean values of Academic Behavioural Confidence both overall, using Sander & Sanders' original, 24-item Scale, together with the mean values of ABC on a factor-by-factor basis where these 5 factors have been established through a factorial analysis of the data collected from the complete datapool, the process for which is described in detail below.
Effect size measures will be the main points of statistical evidence used to argue against the Null Hypotheses presented above, with these data analysis outcomes comprehensively supported by the more conventional measure of statistical difference between independent sample means, Student's t-test. Hence the key findings in the summary table below are the effect size differences between means and the corresponding outcomes from the t-test analyses of the differences between the mean values. A one-tail test was conducted because in every case the alternative hypothesis was that i) the mean values for RG:ND-400 are higher than the mean values for RG:DI-600 and ii) the mean values for RG:DNI are higher than the mean values for RG:DI-600. Homegeneity of variances was established using Levene's Test and according to the output, the appropriate p-value was taken. Hedges 'g' effect size is used because the sample sizes are significantly different in all comparison cases which requires the weighted, pooled standard deviations to be used.
Key Outcomes
KEY OUTCOMES:
1. In comparison with their non-dyslexic peers (RG:ND), students with a declared dyslexic learning difference (RG:DI) present a significantly lower level of Academic Behavioural Confidence, with a large effect size difference (g=1.03) between the mean values of ABC24. There is sufficient evidence to reject the Null Hypothesis (1) and accept the Alternative Hypothesis (1).
2. Apparently non-dyslexic students (RG:DNI) but who show a level of dyslexia-ness that is comparable to their declared, dyslexic peers present a significantly higher level of Academic Behavioural Confidence in comparison to a control group of declared, dyslexic peers (RG:DI-600), with a medium effect size (g=0.48) difference between the mean values of ABC24. There is sufficient evidence to reject the Null Hypothesis (2) and accept the Alternative Hypothesis (2).
![]()
Data and Analysis Report
1. Demographics
Datapool demographics overview
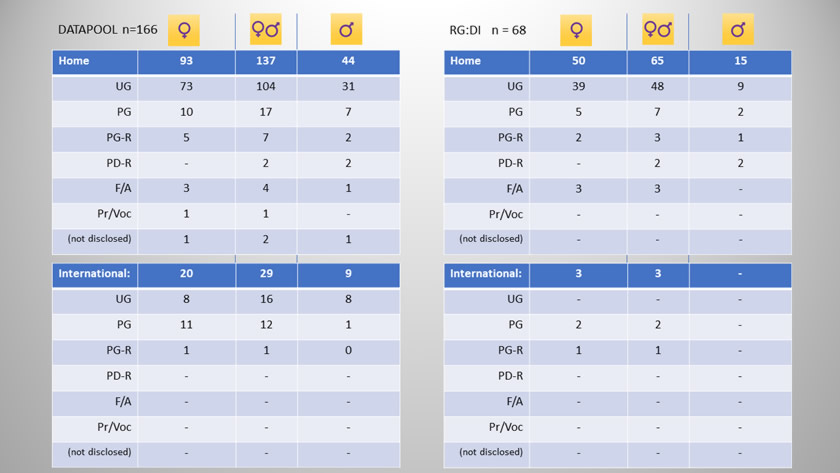
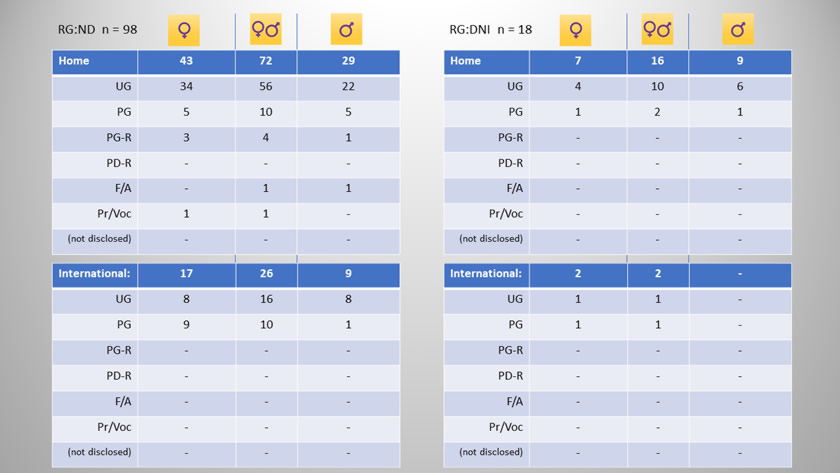
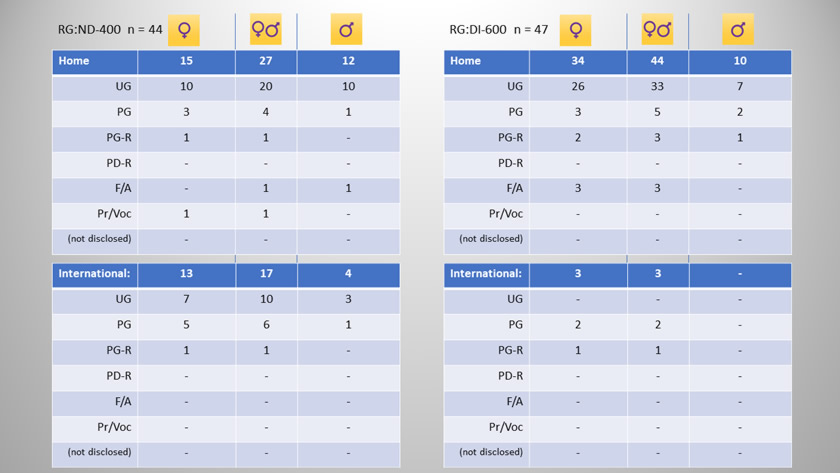
At the end of the questionnaire deployment period a total of n=183 questionnaire replies had been received. Of these, n=17 were discarded because they were more than 50% incomplete. The demographic distribution of participants according to Research Subgroup; gender; student residency: home or international; and student study status: undergraduate (UG), post-graduate (PG), post-graduate research (PG-R), post-doctoral research (PD-R), attending a Foundation or Access Course (F/A), attending a Professional or Vocational Course (Pr/Voc), is shown in tabular and chart form below. A commentary follows which examines each demographic in the context of this study and where appropriate, in relation to wider, national data on student demographics nationally.
Datapool and Research Subgroup: DI
Research Subgroups: ND-400 (= subset of RG:ND), and DI-600 (Control Group = subset of RG:DI)
1.1 Demographics of Research Groups and Subgroups
The charts show the relative sizes of research groups and subgroups as defined by the Dyslexia Index (Dx) boundary values, Dx=400 and Dx=592.5.
The top chart presents the proportion of students of the complete datapool (n=166), who disclosed their dyslexia on the research questionnaire (RG:DI, n=68) against those who indicated no specific learning challenges (RG:ND, n=98). A sample size of n=30 is widely considered to be the minimum for any reasonable statistical analysis to be conducted (Cohen & Manion, 1980) although it is accepted that there is no definitive ruling on sample size because the minimum value needs to be considered in the light of the proposed analysis (Robson, 1993). So by taking these advisories into account it is considered that a complete datapool sample size of n=166 with the two principal research groups dividing the datapool in the ratio 41%:59% (RG:DI, n=68 : RG:ND, n=98) the number of students who returned replies to the research questionnaire is sufficient for a meaningful statistical analysis to be conducted.
The second chart indicates the relative subgroup proportions of research group ND, that is, students who reported no specific learning challenges. It can be seen that in accordance with the Dx boundary values set for the project, 18% of students in research group ND presented levels of dyslexia-ness that were above the critical value of Dx > 592.5 and hence were more in line with students who had disclosed their dyslexia. This is presented in the third chart which indicates more than two-thirds of the respondents who disclosed their dyslexia also demonstrated a level of dyslexia-ness above the critical Dx boundary value set at Dx=592.5. As reported in an earlier section (here) the most recent data acquired from HESA* (Greep, 2017) indicated that students in UK HE institutions who disclosed a learning disability accounted for 4.8% of the student population overall, this being a proportional rise of 50% from the figure quoted by Warmington (2013) for 2006. This is at least one further statistic which supports the observation of many studies that the prevalence of dyslexic students in UK universities is rising for a variety of reason not least through recent initiatives for widening participation in higher education amongst traditionally under-represented groups, particularly those with dyslexia who may have been previously disenfranchised from more formal education (Collinson & Penketh, 2010). Greep pointed out that this figure (4.8%) was an indicator of the incidence of all 'defined' learning disabilities and in addition to dyslexia, included others such as dyspraxia, ADHD and Asperger's Syndrome for example. Greep added that there is currently no mechanism in place in the current data collection process at HESA for discriminating students with dyslexia as a subgroup of those indicating learning disabilities and hence it is reasonable to suppose that the proportion of declared dyslexic students in the UK university population in 2013/14 is likely to be less than the 4.8% quoted, although Greep did indicate HESA's view that dyslexia is likely to be the most represented subgroup. It seems likely that this supposition is based on the generally accepted statistical evidence about the incidence of these learning disabilities more widely. For example, Casale (2015) quoted (unreferenced) HESA data which indicated that 5.5% of university students are disabled where presumably this figure included all disabilities of which students with learning disabilities is a subset, further claiming that dyslexia accounted for 40% of these students - that is, 2.2% of the student population as a whole. Casale drew a comparison with data provided by the British Dyslexia Association (2006) claiming that dyslexia is evident in approximately 10% of the general population of the UK. However estimates of the prevalence of the traditionally considered dyslexia as a reading difficulty in children vary considerably with studies suggesting rates ranging from 5% to 17.5% (Shaywitz & Shaywitz, 2005)
Hence in the first instance it might be concluded that determining true levels of incidence of dyslexia either at university, in compulsory education, or especially in the general population is a challenging statistic to establish. This is certainly consistent with many of the arguments presented in earlier sections of this thesis discussing issues about how dyslexia is defined and hence relating to challenges in measuring it. As a result, it seems reasonable to conclude that it is likely that the true proportion of dyslexic students at university is inevitably higher than the supposedly established data indicates. Secondly, the data collected in this project which, on the basis of the definitions of the metrics used, indicates that a substantial proportion of apparently non-dyslexic students may indeed present dyslexic learning differences - the 18% indicated in the second chart - which adds to the weight of wider research and anecdotal evidence that dyslexia amongst university students is widely under-reported (Richardson & Wydell, 2003, Stampoltzis & Polychronopoulou, 2008) and/or continues to be unidentified on entry (Singleton et al, 1999).
It is also interesting note that of the research group of declared dyslexic students in this project (n=68), 21 presented a level of dyslexia-ness below the critical boundary value of Dx = 592.5. By the criteria established for this project at least, this indicates that these students might have been mis-identified as dyslexic despite their declaration of being so, which was presumably based on a earlier, conventional process of assessment.
*Higher Education Statistics Agency
[868/ # ]
1.2 Gender
For the complete datapool, female research participants outnumbered males by a factor of approximately 2 to 1. That is, there were twice as many females as males in the datapool. (113:53 = 67%:33%, n=166).
Dyslexic student participants who were recruited from the targeted e-mail invitation sent out on the University's Dyslexia and Disability Service's e-mail distribution list and who subsequently were designated as research group DI were in the F:M ratio 53:15 (= 78%:22%, n=68) showing that female participants outnumbered males by a factor of more than 3 to 1, whereas student participants recruited through the open invitation to all students as published on the University's student intranet 'home' webpage, and who subsequently formed research group ND (n=98), were distributed by gender in the F:M ratio 60:38 (= 61%:39%) which although shows that female students still responded more positively to the invitation to participate than males when compared with the gender-analysed response rate, the female bias is lower.
In comparison to the gender distribution of students in the UK more generally, HESA* figures for the academic year 2016/17 for students enrolled on courses at HE institutions showed that although female students outnumbered males, the ratio is much closer to an even balance (F:M 57%:43%). For the UK generally, the ratio of females to males in the population as a whole in 2016 was F:M 51%:49% (Office for National Statistics). It is beyond the scope of this study to explore the reasons behind gender imbalances amongst higher education students however it is interesting to note the apparently significant differences in research participation invitation response rates between the two recruitment processes, although the main reason for this may simply be that students registered with the University's Dyslexia and Disability Service may be heavily biased towards females. This at least would be consistent the argument that at university, male students are less likely than females to engage with learning development or support services either as a result of a known, hidden or unknown disability or learning difference or indeed for any other reason (Fhloinn et al, 2016. Kessels & Steinmayr, 2013, Kessels et al, 2014, Ryan et al. 2009) which is also consistent with some gender differences reported in levels of engagement with education and learning for a variety of reasons but especially in the self-regulated learning contexts which is dominant in higher education settings (Virtanen & Nevgi, 2010). This gender disparity has also been extensively observed and reported anecdotally within my own professional experience and domain of functioning in university learning development services, however it is beyond the scope of this project to engage in a deeper analysis of the reasons behind these differences.
[442/ # ]
1.3 Student residency status
In this project, participants were asked to identify whether they were a 'home' student or an 'international/overseas' student - that is, without separating non-UK EU students from all overseas students. The charts (right) present the distribution of research participants by domicile and for comparison, national data from HESA* for 2016/17 is shown. Although this demonstrates a similar distribution it must be added that the HESA figures are for student enrolment for that academic year rather than a measure of the domicile distribution of all students studying at UK institutions at that time. However, it is reasonable to accept that the ratio of 'home' students to non-UK students would not be significantly different were an aggregated figure used, were it available.
Hence the domicile distribution of the datapool in this study can be considered as representative of the wider student community studying at university in the UK.
However, when domicile distribution is considered at a micro- as opposed to macro-level it is interesting to note (from the data tables above) that only 3 out of the 68 participants in Research Group: DI identified themselves as non-UK students, a figure of just 4.4% which might be an indication of the very low incidence of non-UK dyslexic students studying at UK universities. It is beyond the scope of this thesis to conduct a detailed exploration to account for this, but it is likely that one reason for this apparently low figure may instead be an indication of the lack of available access to the university's Dyslexia and Disability Service for non-UK students with dyslexia. Hence very few non-UK students would have been on the Service's e-mail distribution list to receive the invitation to participate in this research project. The reason for this may be that as non-UK students are not eligible for formal dyslexia identification through the provision of the Disabled Students' Allowance in the UK and as such either may not be eligible to access the learning development and support provided by the Service to dyslexic students or may not even be aware that such a service exists. However it might also be the case that access to dyslexia idenfitication processes in their home countries for these non-UK students is less prevalent than in the UK for a variety of reasons, a fact that might be supported in this research project by comparing the ratio of non-UK to home students for both identified dyslexic students (RG:DI) and apparently-unidentified dyslexic students (RG:DNI). For dyslexic students in research group DI this ratio is the 3 in 68 (4.4%) as mentioned above. Students sifted into research subgroup DNI as a result of their Dyslexia Index values of Dx > 592.5, the ratio is 3 in 18 (16.7%) which, at face value alone, suggests that there exists a significant proportion of un-identified, apparently dyslexic, non-UK students in this datapool at least. However as this subgroup is small (n=18) it would be inappropriate to draw significant conclusions from this disparity 4.4%/16.7%, as it may be accounted for through margins of error. It would be necessary to establish a much larger subgroup of apparently non-dyslexic students who were presenting high levels of dyslexia-ness and hence examine the distribution ratio of 'home' to non-UK students to enable a more robust conclusion to be drawn.
[547 / # ]
1.4 Student study status
It was considered useful to obtain data relating to the level of study programmes of students participating in the research not least to determine whether the research datapool constituted a reasonable cross-sectional match to the wider student community. If so, then it follows that conclusions derived from the research outcomes might reasonably be considered as representative of students attending UK universities more generally.
The charts present the proportions of student participants in the datapool according to level of their study programmes and comparisons with nationally collected data for 2016/17*. To enable a like-for-like comparison as far as is possible, those participants in this project who indicated study for professional or vocational qualifications were grouped with post-graduates, with post-grad- and post-doc researchers being combined. It is of note too that the national data labelled here as those studying at Foundation/Access level also includes those studying at pre-level 4 (1st year undergraduate).
From these it can be seen that in comparison to national data, undergraduate respondents in this study are over-represented although when undergraduates and foundation/access level students are combined, the proportions are closer (76% : 66%).
*HESA 2016/17 available at: https://www.hesa.ac.uk/data-and-analysis/students/whos-in-he, accessed on: 16 April 2018)
[201 / # ]
2. How dyslexic students learned of their dyslexia
The impact of receiving a diagnosis of dyslexia on Academic Behavioural Confidence
One aspect of the enquiry aimed to find out more about how dyslexia becomes known to students who have declared it on their QNR response. This is pertinent as the research hypotheses imply that it may be the label of dyslexia which is one of the factors that contribute to reduced Academic Behavioural Confidence in students with dyslexia in comparison to their peers but especially how that label is attributed. Further that this may impact on academic achievement due to reduced academic self-efficacy possibly associated with the effects of stigma on the social identity of dyslexic students at university (Jodrell, 2010). One of the undercurrents to the project is the recognition of the stigma that is reportedly associated with the label of dyslexia (Morris & Turnbull, 2007, Lisle & Wade, 2013). The sub-hypothesis being tested is that students whose dyslexia was diagnosed to them as a disability have significantly lower levels of academic confidence in comparison to students whose dyslexia was made known to them in ways that referred to neither 'diagnosis' nor to 'disability'. If evidence emerges to support this hypothesis, then the contention being suggested is that their lower acadeimc confidence is an indication of the negative internalization of dyslexia into their self-identity due to a perception that the outcome of their 'disability diagnosis' will be that they will be valued less by their peers or society more generally as a result of it, a characteristic typically associated with stigmatization (Goffman, 1963 in Ainlay et al, 2013).
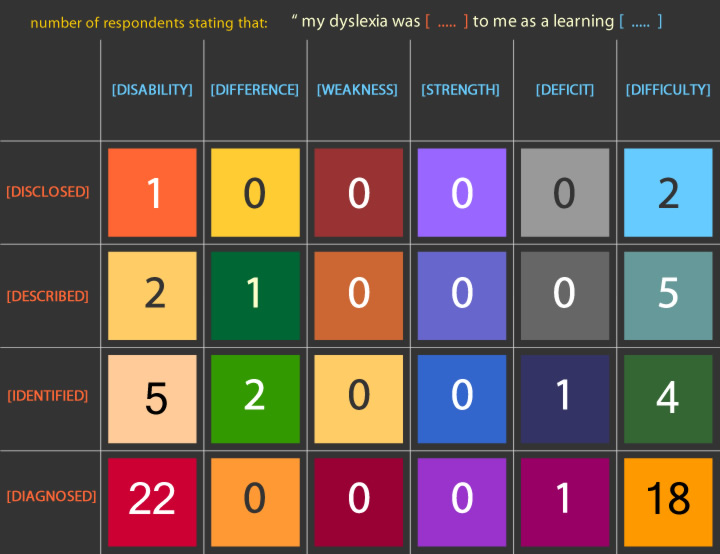
To explore this, QNR respondents who were acknowledging their dyslexia were also invited to complete a sentence in the opening section of the QNR to report how they learned about their dyslexia. It was assumed that such students had previously participated in a formal dyslexia screening and/or assessment, typically conducted through the conventional process adopted by UK universities, or that their dyslexia assessment had been conducted previously during their earlier years in education. The sentence required selections to be made from two drop-down menu lists so that on completion it would indicate how the respondent was informed about their dyslexia as an outcome of a screening or a full assessment.
The summary grid below sets out this data from the 68 responses who had acknowledged their dyslexia which constituted research group DI. The grid total is actually 64, as 4 respondents in research group DI did not select options. The grid presents the number of respondents who selected particular combinations of options. For example, in the first row of the grid it can be seen that 2 respondents completed the sentence as: 'My dyslexia was DISCLOSED to me as a learning DIFFICULTY'. What is especially relevant to this part of data analysis is that the majority of dyslexic students reported that their dyslexia was ‘diagnosed’ with diagnosed as a disability recorded slightly more often in comparison with disagnosed as a difficulty. This it seemed reasonable to explore the Academic Behavioural Confidence of students whose dyslexia had been diagnosed as a difficulty or a disability, with the expectation for this to be at a reduced level when compared to their otherwise-identified peers.
It seems reasonable to argue that when informing an individual about their newly discovered dyslexia, using the most neutral and unbiased phraseology is likely to be the least discomfiting to them and so identifying dyslexia as a difference seems to be the most appropriate turn of phrase to use. Hence it would be expected that this would reduce the likelihood of dyslexia being internalized into the student's self-identity as a medical condition, tacitly implied by ‘diagnosing’ it, especially given the largely negative construction of disability in society more generally (eg: Connor & Lynne, 2006, Phelan, 2010).
To date, no other studies have been found which specifically explore the impact of how dyslexia is communicated to the student concerned following a screening or assessment at university although some studies do examine the psychosocial experiences of receiving an identification of dyslexia. For example Nalavany et al (2011) claimed to have conducted the first study to explore how confirmed and self-identified dyslexia impacted on adult perspectives of their experiences associated with their dyslexia. This research was concerned less with how the adults in the research group (n=75) experienced the impact of their dyslexia on their learning and more so with how it affected their day-to-day lives and the study did not report on the ways in which individuals had learned of their dyselxia. However many of the participants recollected school and learning experiences that were 'hurtful, embarrassing, and scary', and that their teachers misunderstood their learning challenges (ibid, p74) which at least documents how the lasting effects of experiencing 'being different' in younger years can persist into adulthood.
Another important and relevant study by Armstrong & Humphrey (2008) has already been referred to in the literature review section of this thesis but its main findings are particularly pertinent to this section despite their research datapool being adolescents at school or college rather than adults studying at university. Their study was also concerned with the psychosocial components of living with the label of dyslexia (ibid, p96) and although the outcome of their project led to the proposal of a fresh model for understanding how individuals assimilate their dyslexia into their self-identity (the Resistance-Accommodation Model as briefly discussed earlier), their model clearly has merit for gaining a clearer understanding about the 'dyslexic self', despite the study persistently referring to how individuals accommodated their diagnosis of dyslexia. The use of this phraseology did not appear to have been considered as a factor that might influence an individual's internalization of new knowledge about their dyslexia following its identification through a conventional assessment process, even though the authors did acknowledge that 'the amount of resistance or accommodation displayed by individuals clearly stems at least in part from their perception of dyslexia' (ibid, p99). My argument here is that this perception of dyslexia might also, in part, be influenced by the ways in which an identification of it is communicated and that has been the purpose of this part of the research questionnaire. Through just this cursory analysis and reflection on the meaning of the data produced, this is probably indicating the need for a deeper, follow-up study to be conducted at a later time.
Thus it seems likely that as long as dyslexia remains perceived even as a 'difference' and hence dyslexic people internalize themselves as 'different', there will remain a stigma attached to the label. Having argued this, it is interesting to note however that at least one research study concluded that an important process in understanding stigma associated with the labelling of difference is that the role of labelling needs deconstructing (Riddick,2000). One suggestion that emerged from that study was that the ownership of the labelling process by individuals concerned needs to have a focus on self-definition, personal understanding and elements of control (ibid, p665), which tacitly implies that part of the identification process (although Riddick uses 'diagnosis' rather than identification) should include an element of positive counselling as part of the 'telling' procedures to the individual concerned so that the process of incorporating this new self-knowledge into the self-identity might be less psychologically unsettling. This is the view taken by Ho (2004) whose strongly argued essay on the dilemma about labelling learning disability (dyslexia) supports the view that attributing a dyslexic identity to a learner can be as unnecessary as it can be counter-productive when the uniqueness of individuals' learning is taken as the context, further arguing that curricula and delivery need to be designed flexibly to accommodate this - a view that strongly resonates with the stance of this current research project. Mention of Riddick's and Ho's studies have been included as part of the discussion in an earlier section of this thesis (here) where I have briefly discussed the 'dilemma of difference' originally suggested by Minow and more lately researched by Norwich amongst others.
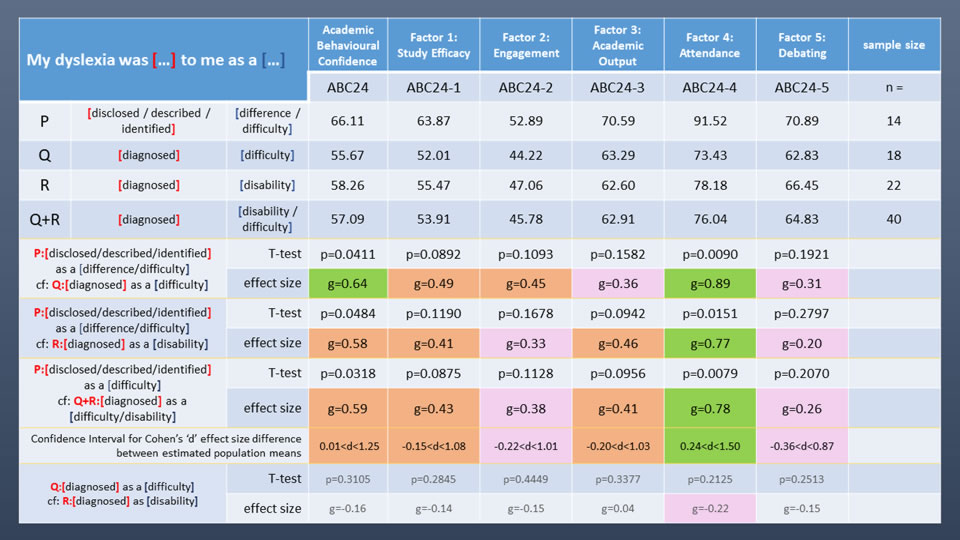
So how does the data collected in this study from the 68 research participants who declared their dyslexia in the research questionnaire fit in with these reflections? Responses from students who disclosed, described or identified their dyslexia as a difference or a difficulty were sifted into a single subgroup leaving those whose dyslexia was diagnosed as as a disability or a difficulty being sifted into a comparator subgroup. (4 participants who declared their dyslexia did not complete the declaration sentence and hence for the purposes of this analysis the complete group comprises 64 participants). The table below sets out the summary of a statistical analysis to compare the mean values of Academic Behavioural Confidence overall and of Academic Behavioural Confidence factors as determined from a principal component analysis of the complete datapool, a description of which is presented later in this section (here). Student's t-test was used to determine whether these data presented a significant difference between means using a one-tail test, because we are testing the hypothesis that students whose dyslexia was disclosed/described/identified as a difference/difficulty present a significantly higher level of academic behavioural confidence than students whose dyslexia was diagnosed as a disability/difficulty; equal variances were assumed and tested using Levene's test with the normality of the data being established through the Shapiro-Wilk test. Arguably more interesting and more informative than t-test outcomes are effect sizes between means, where it has been observed through the review of the more recent, relevant literature for this project that this is being increasingly widely used as an outcome measure amongst researchers in psychology, educational psychology and the social sciences more generally. Here, as with data analysed and reported below, Hedges 'g' is the effect size measure chosen and the rationale for using this over the more conventional Cohen's 'd' has been outlined in the previous section where the research methodology for the study was reported. For this analysis, an effect size of g < 0.20 is considered small to negligible, a value of 0.20 ≤ g < 0.45, small to medium, 0.45 ≤ g ≤ 0.6, medium, and g > 0.6 medium to large. Defining boundary values for effect size measures remains a matter for some debate, perhaps because this is a relatively new statistical measure that has only in recent years attracted interest not least because it establishes a measure of an absolute difference between data sample means. This has been discussed more fully above (here). For the summary table of results below and in order to make the reporting of the outcomes more comprehensible and less repetitive, letter designations P,Q,R, have been added to aid clarity so for example, table row Q presents the subgroup of students whose dyslexia was diagnosed to them as a difficulty, and so forth. The table sets out the mean values for Academic Behavioural Confidence overall and for each of the five ABC factors for each respective combination of the sentence 'my dyslexia was [...] to me as a learning [...]' completed by the participants, together with t-test 'p-values' and effect sizes for the differences between these means.
From the table, interesting and significant observations can be made:
- In the summary row for the comparison of means between students whose dyslexia was disclosed/described/identified to them as a learning difference/difficulty (P) and those whose dyslexia was diagnosed to them as a difficulty (Q) the analysis shows that there is a significant difference at the 5% level (p=0.0411) between the means values of overall Academic Behavioural Confidence, with an effect size of g = 0.64 which is medium to large; when the same first subgroup (P) is compared with students whose dyslexia was diagnosed to them as a disability (R) there is also a significant difference between the overall ABC means at the 5% level (p=0.0484) and a slighly lower effect size of g = 0.58. It is somewhat surprising that the effect size was greater when dyslexia was diagnosed as a difficulty rather than as a disability, however given the small sample sizes it is likely that this is within margins of error and the p-values and effect sizes are broadly the same. Nevertheless, to explore this a little further, t-test and effect size calculations were conducted between subgroups Q and R (at the bottom of the table) and as expected, small or negligible effect sizes were obtained together with no significant differences between the overall ABC means nor ABC-factor means being established from the t-test.
- Hence the most significant (sic) results in relation to the discussion above are the comparision of means and effect sizes between the subgroups of students whose dyslexia was disclosed, described or identified to them as a learning difference or difficulty, and students whose dyslexia was diagnosed as a difference or disability (P, and Q+R). For this comparison of means for academic behavioural confidence overall, a significant result at the 5% level is indicated (p=0.0318) with a medium effect size of 0.59. So for the data collected in this study and within the limitations on drawing conclusions due to the small sample sizes, it would appear that students whose dyslexia is diagnosed to them appear to present a significantly lower academic behavioural confidence when compared with students whose dyslexia was identified, described or disclosed to them. This is an important result as it may be suggesting that the phraseology used to communicate new knowledge of a learning difference that may be attributed to dyslexia to a student at university has a measurable impact on the confidence that they subsequently bring to their studies. It must be restated that these sample sizes are small and so any conclusions derived from the analysis of data within them is tentative but it might be an indication of the difference in perception of dyslexia when communicated as a diagnosis rather than more neutrally and might merit a deeper investigation in a subsequent study. For students in this study at least, this does provide some evidence that those whose dyslexia has been diagnosed to them as a difficulty or a disability may have experienced a reduced impact on their academic confidence had their dyslexia been disclosed, described or identified to them as a learning difference. It is unfortunate that so few students in this study learned of their dyslexia as a difference, as it having a greater sample size would have enabled a further, useful layer of analysis to have been added which may have been able to determine whether there is a measurable distinction in academic confidence between those with dyslexia identified as a difficulty and those with dyslexia identified as a difference, which could have added further weight to the argument that paying careful attention to the ways in which a new identification of a dyslexia may be assimilated into an individual's learning identity can have significant, impacting consequences in relation to their confidence in their study approaches at university.
- ABC factors have been determined using factorial analysis (principal component analysis (PCA)) on the data collected for this study and the rationale for conducting PCA on my datapool rather than rely on the factorial analysis conducted by the originators of the ABC Scale (Sander & Sanders, 2006) have been discussed in the Research Design section of this thesis earlier (here), with a more detailed report on the how the outcomes of the statistical analysis derived the factors used in this study being presented below.
The table above presents a breakdown of the outcomes of the t-test and effect size analysis of differences in mean values for each of the five factors that emerged, designated: study efficacy, engagement, academic output, attendance, and debating.
- Note that for all ABC factors, the mean Academic Behavioural Confidence values for students whose dyslexia was disclosed, described or identified to them as a learning difference or difficulty (P) appears substantially higher than for students whose dyslexia was diagnosed (Q,R, and Q+R). Taken at face value, this appears to be suggesting that when dyslexia is diagnosed, this may be one of the impacting factors that contributes towards a reduced level in all factors of academic behavioural confidence as well as in the overall level of academic behavioural confidence in dyslexic students compared with those who have learned of their dyslexia in more neutrally-loaded ways. The Dyslexia Index (Dx) metric has also been analysed using PCA to determine whether there are combinations of factor-by-factor interrelationships between factors of Dyslexia Index and the factors of Academic Behavioural Confidence. The results of the analysis do identify interesting results and a detailed report and discussion is provided below (here).
- In the table row that presents the analysis outcomes for students whose dyslexia was disclosed, described or identified to them as a learning difference or difficulty (P) and students whose dyslexia was diagnosed to them as a difficulty or a disability (Q+R), only for the factor: attendance did the t-test identify a difference between ABC factor means as significant, in fact, a p-value of p=0.0079 being less than the critical p-value of p=0.01 indicates this to be a highly significant difference in means. The effect size of g=0.78 is high and by looking at the mean ABC values for this factor of ABC24-4 = 91.52 (for the subgroup with the summary table designation 'P') and ABC24-4 = 76.04 (Q+R) we can observe that the actual difference is indeed substantial. This outcome suggests that students whose dyslexia is diagnosed may be less diligent in attending their classes, lectures, seminars and other university teaching scenarios than students whose dyslexia had been identified, disclosed or described to them. It is reasonable to hypothesize that this may be due to these students perceiving and internalizing their dyslexia as a clinical condition alluded to through use of the term diagnosis rather than as an identifiable learning difference. It is possible that this induces feelings of discomfort in the company of their student peers should their dyslexia become apparent because these diagnosed dyslexics may have internalized their dyslexia as a perception that there is something wrong with them that they would prefer not to be revealed to their classmates, either explicitly or more likely as inadvertently disclosed by their classroom responses, hence a reduced class attendance may have been developed as an avoidance strategy. To explore this in more detail a focused study would need to be conducted which could be designed to tease out students' perceptions of the meaning of diagnosis in relation to their dyslexia which might provide evidence that by identifying dyslexia through use of terminology more widely attributed to clinical or medical conditions that are problematic and need a cure, such students perceive their dyslexia in a similar way.
This may be consistent with observations of the day-to-day learning lives of dyslexic students at university conducted in a study by Cameron (2016) which, although might be considered limited due to the case study approach of deeply analysing learning diaries from just 3 research participants, did reveal some relevant points. Notably that in learning situations in which they were attending as members of a class, seminar or lecture in the company of other students, all three participants appeared to find these learning experiences uncomfortable or threatening, reporting 'fear of speaking out in seminars or discussions' so as not to appear 'stupid or incompetent in some way', that they all felt 'different from others', 'less able or intelligent' and that they 'didn't belong' in academic spaces (ibid, 228). All three participants also reported considerable difficulty in verbalising their ideas and thoughts when speaking out in university spaces and how this made them often feel awkward and demoralised. Hence it seems reasonable that students with dyslexia who experienced such difficulties might easily choose to avoid such learning situations where possible. However although this study sharply identifies how some dyslexic students feel when they are learning in the company of their peers, Cameron's study does not mention how these students learned about their dyslexia so we can only surmise that these students are more than likely to have had their dyslexia diagnosed than identified to them in some other way by basing this assumption on the data collected in my study where the majority (60%) of students in my research subgroup of students with dyslexia had their dyslexia communicated to them as a diagnosis rather than in any other way. Cameron's pertinent concluding remarks: 'having the dyslexic label means being constructed by discourses of learning, disability and literacy as an outsider within the education system' and 'there is a justification for some adjustments ... to pedagogy within higher education, (ibid, p235), resonate with the findings above and indeed with the stance of this project. However, evidence is also emerging that many of the competing demands faced by dyslexic students are equally faced by some other contemporary learners. Fraser (2012) suggested that it might be argued in the context of widening participation that many non-dyslexic students from non-traditional educational or socio-economic backgroups also face complex social-learning needs that can impact on their engagement with their studies at university. This point will be explored more fully in the 'Discussion' section of this thesis below (here).
- For the ABC factor, Engagement, although the t-test outcome indicated a difference between the means (for P, and Q+R) that was not significant (p=0.1128) there was nevertheless a small-to-medium effect size, g=0.38 between the mean ABC24-2 values of 52.89 and 45.78 in favour of students whose dyslexia had been disclosed, described or identified to them. Some elements of the factor Engagement are shared with the factor Attendance as shown by the report on the PCA of Academic Behavioural Confidence below, thus it would have been a surprising result had a similar analysis outcome here for the factor Engagement not emerged in comparison with the factor Attendance.
- For Factors 1, Study Efficacy and 3, Academic Output, if considered at the less conventional, 10% level, then the t-test returned significant differences between the ABC Factor means for students whose dyslexia was diagnosed to them in comparison to those whose dyslexia was disclosed, described or identified, ABC24-1: p=0.0875, ABC-3, p=0.0956. In any case, with effect sizes of g=0.41 and g=0.46 respectively, both considered as 'medium', these are indicating an absolute difference between the means that cannot easily be dismissed. Only for the ABC Factor 5, Debating, did the t-test return a notably not significant difference between the means, (p=0.2070), this being supported by an effect size of g=0.26, considered as 'small'.
This analysis indicates that there is a likelihood that the means by which dyslexic students are informed about their dyslexia may be a contributing factor to a measurable impact on their academic behavioural confidence, and hence their academic confidence about approaching their studies at university. It is admitted that with a total sample size of 64 students the sample sizes are small for the subgroups between which differences in mean ABC values have been analysed but given the consistent differences in favour of students who have NOT had their dyslexia diagnosed, the outcome of this analysis does suggest that a further study might be warranted. What seems clear is that the manner in which individuals make sense of their dyslexia and internalize its meaning to them into their academic self-identity is an interesting, relevant and relatively under-researched area, especially in higher education settings. Of particular interest and relevance to the brief analysis above is the research outcome of a study by Thompson et al (2015) which was interested in how adults more generally constructed personal identities and the extent to which these are positioned within discourses of disability or of individual difference. In analysing the themes that emerged from contributions to an online dyslexia support forum, Thompson et al established that significantly, the majority of contributors indicated a greater alliance with the perception of dyslexia as differences in ability than with disability. However of greatest interest was the finding that many felt encumbered by an identity of dyslexia as a disability in educational contexts (ibid, p1328). The authors were able to establish that three distinct identity personae were identifiable: that of being learning-disabled where the dyslexia was focused on impairments and deficits; of being differently-enabled, in which dyslexic individuals were able to focus on their strengths and celebrate their alternative ways of thinking and learning as an asset rather than as a liability, a construction that draws much from the idea that dyslexia is an example of natural neurodiversity, a thesis strongly argued for by Cooper and Pollack amongst others and briefly discussed earlier (here); and finally, a dyslexia-identity construction that was rooted in social-disablement where individuals felt disabled by the ways in which they perceived barriers to be preventing them from conforming to the aspirations of a society which focuses on literacy as a marker of ability, achievement and normality.
Thus the outcomes from this small-scale analysis that has been conducted within this larger study makes a significant contribution to the overall argument being proposed, that a greater effort needs to be made to firstly recognize dyslexia - in whatever ways it can be defined - as a difference rather than as a disability, and secondly that were learning environments designed and structured in a more genuinely inclusive ways, the impact of such learning differences on academic confidence would be further reduced, with the counterpoint that learning quality and hence achievement is likely to be enhanced for students whose learning styles, needs and preferences are atypical.
3. Dyslexia Index
Recall that the research outcomes of this study are heavily reliant on the extent to which the Dyslexia Index Profiler has returned an accurate representation of research participants' levels of dyslexia-ness. This output has been generated by taking as its focus, the range of study skills and learning access, consolidation and synthesis strategies, which are features of how all students engage with their learning at university, rather than by viewing the learning characteristics of dyslexic students through the lens of literacy skills alone. Further recall that the Dyslexia Index Profiler has first determined levels of dyslexia-ness from known dyslexic students and hence used this data to enable Dyslexia Index boundary level criteria to be established. This process has been fundamental to firstly determining whether or not dyslexia, when considered through the lens of academic learning management criteria, can be suggested to have a measurable impact on intrinsic academic confidence; and secondly whether dyslexia-ness can be used as viable discriminator in this non-cognitive context of university study (i.e. not related to academic ability) to identify quasi-dyslexic students from amongst the research group of those who declared no dyslexic learning differences in the research questionnaire. Hence it is necessary to demonstrate as part of this thesis, the comprehensive steps have been taken to firmly establish the Dyslexia Index Profiler as a robust metric for its intended design purpose.
Preliminary analysis outcomes from Dx Profiler data
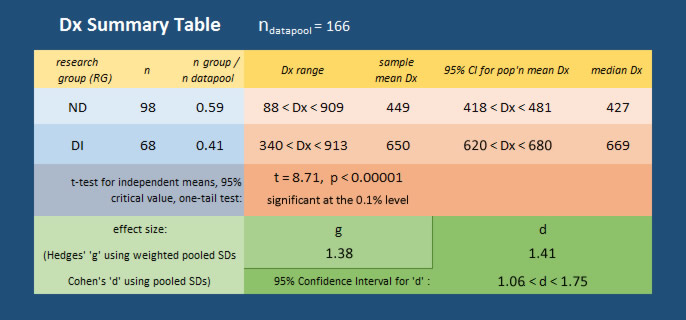
In total, 183 questionnaire responses were received of which 17 were discarded because they were less than 50% completed or 'spoiled' in some other way. The remaining 166 datasets are collectively referred to as the datapool. Of these 166 good quality datasets, 68 are data collected from students with dyslexia leaving a remainder of 98 datasets from students who indicated no dyslexic learning challenges. The metric Dyslexia Index (Dx) has been used to gauge participants' levels of dyslexia-ness and to establish research subgroups. The table below presents an overview of the distributions of Dx values across the two main research groups, ND and DI, and below that, the distribution curves for the data of both research groups together with the key descriptive summaries of the mean Dx values and the 95% Confidence Interval Estimates for the population means.
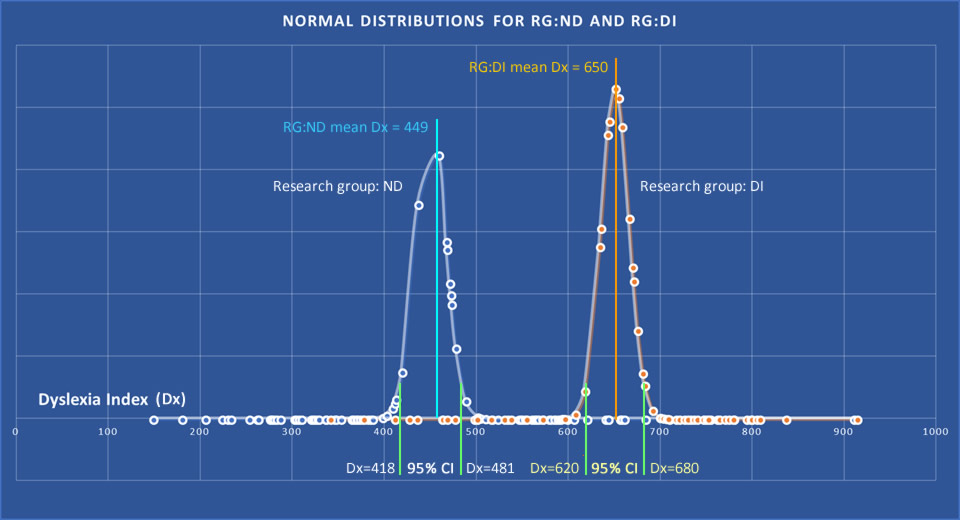
It can be seen in Figure 20 that firstly, both groups’ distributions approximate to the typical bell-shaped curve associated with the normal distribution; and secondly that there are marked differences between the Dx values for the two primary research groups, notably:
- both the sample mean Dx and median Dx for the group ND are much lower than for the group DI;
- on close inspection of the normal distribution curves it can be clearly seen the extent to which the upper tail of the curve for research group ND overlaps with the lower tail of research group DI, indicating that there are a significant number of participants in both research groups whose Dyslexia Index values placed them in a mid-range position, approximately 500 < Dx < 600, or to be more specific, in a range that might be considered as between the upper confidence interval limit of RG:ND and the lower limit of RG:DI, that is: 481 < Dx < 620. At least three explanations may account for this:
Nevertheless, displaying the distibutions in this way clearly demonstrates the disparity in levels of Dyslexia Index between the research groups ND and DI.
- there are students in research group DI, who have declared their dyselxia, but whose Dyslexia Index indicates that their dyslexia may have been mis-identified or 'borderline';
- there are students in research group ND who are showing some indications of dyslexia-ness as determined by the criteria of the Dyslexia Index Profiler;
- this variation in both research groups is naturally occuring or contains too small a number of participants for meaningful conclusions to be drawn;
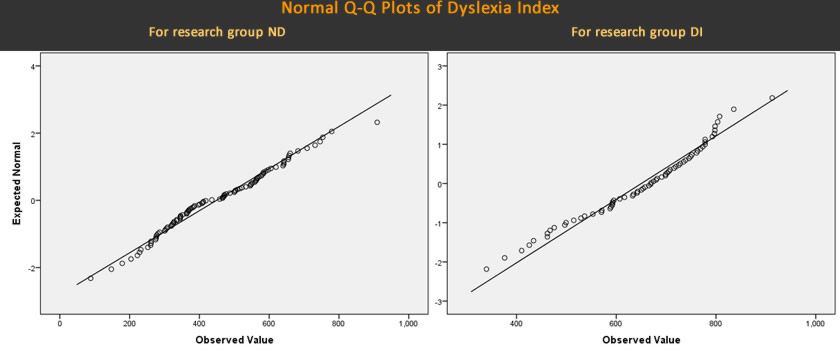
- Student's t-test for a difference between independent sample means was conducted on the complete series of datasets for each group. A one-tail test at the 5% critical value was implemented because the aim was to determing if the sample mean Dx for students who offered no declaration of dyslexia is significantly lower than the sample mean Dx for students who were declaring dyslexia. The Shapiro-Wilk test for normality indicated that both distributions were approximately normal and this test was used in addition to interpretations of Q-Q plots (below). By displaying the datapoints for each research group, ND and DI, given that in both cases these are all positioned approximately along the diagonal, these Q-Q plots also indicate that the distributions are approximately normal. Hence two fundamental assumptions for applying Student's t-test to the distributions is satisfied.
It can be seen from the data table (top) that the resulting value of t = 8.71 generated a 'p' value of < 0.00001 which is indicating greater than a very high a level of significant difference between the mean Dx values. Although Levene's test for homogeneity of variances was violated (p = 0.009), the alternative Welch's t-test, to be used when population variances are estimated to be different, returned the values t = 9.301, p < 0.00001 which is similarly indicating a very highly significant difference between the mean values of Dx.
- The Hedges' 'g' effect size result of g = 1.21 is indicating a large to very large effect size for the difference (Sullivan & Feinn, 2012) in the Dx sample means. Hedges' 'g' is preferred as although it is based on Cohen's 'd', its calculation uses a weighted, pooled standard deviation based which is considered to be better when the sample sizes are not close.
- Cohen's 'd' effect size is also calculated as it is possible to create a confidence interval estimate for this effect size difference between the estimated population means (Cumming, 2010), so together with Hedges' 'g', these are also indicating that there is a strong likelihood of significant differences between the Dyslexia Index of students with reported dyslexia and those without.
These are the expected results and are indicating that the Dyslexia Index Profiler is returning a high Dx value for the majority of students participating in the enquiry who declared their dyslexia and a much lower value for those who declared no dyslexic learning challenge. This outcome indicates that the metric that has been designed for this project as a dyslexia-ness discriminator is generating Dx value outcomes that would be consistent with prior identifications of dyslexia or not. It is of note, and reported elsewhere in this thesis, that in searching for an alternative to existing dyslexia identifiers for use in higher education contexts, Chanock et al (2010) had more confidence in the outcomes from a relatively early self-report questionnaire as a discriminator for dyslexia (Vinegrad's Adult Dyslexia Checklist, 1994) than in the much more involved and formalized York Adult Assessment (Hatcher et al, 2002) which failed to identify a substantial majority of the dyslexic students in Chanock et al's research group as dyslexic. Although there are caveats to their disappointment in the discriminatory performance of the York assessment, their evidence was clearly in support of the benefits of a simple self-report questionnaire which presents a range of typical issues, challenges and difficulties commonly faced by adult dyslexics was clear.
For the research datapool in this enquiry (n=166), it is important to note from the long upper tails to the two confidence interval estimates and normal distribution charts above, that there are a number of participants in the non-dyslexic research group ND who presented significantly higher levels of dyslexia-ness than the majority of their non-dyslexic peers. Indeed, with the upper range limits of distributions for both research groups ND and DI at values within a point or two of each other in the low 900s, this is strongly suggesting that the Dyslexia Index Profiler is identifying students from amongst those who had not declared any dyslexic learning challenges but who appear to be presenting levels of dyslexia-ness in line with the majority of their dyslexic peers. Even taking in account the caveat that the Dyslexia Index Profiler was not built as an assessment or screening tool for dyslexia, this evidence suggests that it could be developed for such a use in higher education contexts, responding to the needs expressed in Chanock et al's paper (ibid) and others who also argue for alternative forms of profile assessment to support students at university who present dyslexia or dyslexia-like characteristics (Casale, 2006, Harkin et al, 2015).
Setting boundary values for Dx
Setting the boundary value for Dyslexia Index in research group ND has been an essential element of the analysis process so that it acts to filter out student responses in this group into the Test subgroup, DNI. As the data analysis process has progressed, a critical evaluation of the setting of boundary values has been applied. Once the data collection period was concluded and all participant questionnaires had been processed, a cursory inspection of the data suggested that setting Dx = 600 as the filter seemed appropriate because the majority of students with declared dyslexia returned a value of Dx > 600. Using this boundary value in research group ND generated a dataset subgroup of n=17 respondents with no previously reported dyslexia but who appeared to be presenting dyslexia-like characteristics according to these high Dx values. By virtue of this boundary value nearly 20% (n=17) of the non-dyslexic students who participated in the research appear to be presenting unidentified dyslexia-like profiles. This is consistent with widely reported research suggesting that the proportion of known dyslexics studying at university is likely to be significantly lower than the true number of students with dyslexia or dyslexia-like study characteristics (Richardson & Wydell, 2003, MacCullagh et al, 2016, Henderson, 2017). Conversely, setting a lower boundary value of Dx = 400 has been essential for establishing the additional comparator subgroup of students from research group ND who are highly unlikely to be presenting unidentified dyslexia - designated research subgroup ND-400, the Base subgroup group. It is considered that this is justified through a similar but 'opposite tail' argument where the majority of students from research group ND who remained in this group after research subgroup DNI had been sifted out, presented a Dyslexia Index of Dx < 400 (n=44, 55%). Only 2 students with declared dyslexia (from research group DI) presented Dx values of Dx < 400.
Research Group Research SubGroup Criteria ND ND-400 students in research group ND who present a Dyslexia Index (Dx) of Dx < 400 - the BASE group; DNI students in research group ND who present a Dyslexia Index of Dx > 600 - this is the group of greatest interest and is the TEST group; DI DI-600 students in research group DI who present a Dyslexia Index of Dx > 600 - this is the CONTROL group;
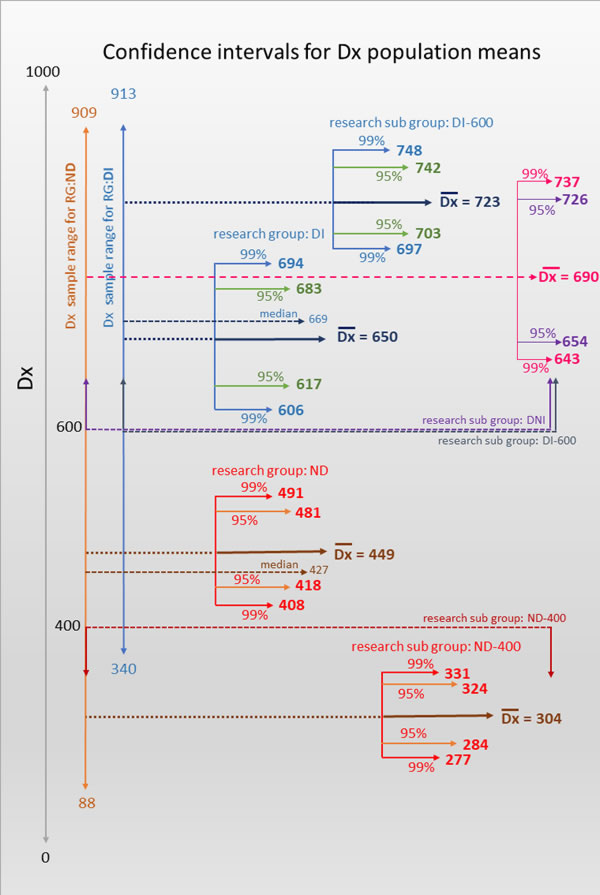
The graphic below supports these boundary value conditions by presenting the basic statistics for each of the research groups and subgroups including confidence interval estimates for the respective population mean Dx values. Thus it is argued that setting Dx filters at Dx = 400 and Dx = 600 was a reasonable starting point for the data sifting process. Note particularly the lower, 99% confidence interval boundary for the population mean Dx for students with identified dyslexia (RG:DI) falls at Dx = 606, and the respective 99% lower CI boundary for students with no previously reported dyslexia falls at Dx = 408, which suggests that the two students with declared dyslexia but whose Dx values fell below Dx = 400 may be safely considered as outliers.
However, in order for the Academic Behavioural Confidence for the subgroups to be justifiably compared, particularly ABC values for the subgroups of students with identified dyslexia from the dyslexic group presenting Dx > 600, (RG:DI-600, this is the Control subgroup) and students presenting dyslexia-like profiles from the non-dyslexic group by virtue their Dyslexia Index values also being Dx > 600, (RG:DNI, this is the Test subgroup) it is important for the key, defining parameter of Dyslexia Index for each of these two subgroups to be close enough so that it can be said, statistically at least, that the mean Dyslexia Index for the two subgroups is the same. Hence, and as can be seen in the graphic above, with research subgroup DNI presenting a mean Dx = 690, some 33 Dx points below the mean for research subgroup DI-600 (mean Dx = 723), it was felt necessary to conduct a t-test for independent sample means to establish whether this sample mean Dx = 690 is significantly different from the sample mean Dx = 723. If not, then the boundary value of Dx = 600 remains a sensible one for sifting respondents into research subgroup DNI, however if there is a significant difference between these sample means then this is suggesting that the two subgroups are not sharing the similar (background population) characteristic of mean Dx and hence comparison analysis of other attributes between these two research subgroups could not be considered so robustly, specifically the subgroups' Academic Behavioural Confidence.
Thus on conducting a Student’s t-test for independent sample means on research subgroups DI-600 and DNI, set at the conventional 5% level and as a one-tail test because it is known that the sample mean for research subgroup DI-600 is higher rather than merely different from that for research subgroup DNI, the outcome returned values of t = 1.6853, p = 0.0486 (calculation source here) indicating that there is a significant difference between the sample means of the two research subgroups, albeit only just. Following several further iterations of the t-test based on selecting different boundary Dx values close to Dx = 600, an outcome that is considered satisfactory has been established using a boundary value of Dx = 592.5. This returned a t-test result of t = 1.6423, p = 0.05275 which now suggests no statistically significant difference between the sample means, although again, this p-value is only just outside the ‘significant’ boundary value of the test.
Adjusting the Dx boundary value in this way has been marginal, as the impact has been to increase the sample sizes of research subgroup DNI from n=17 to n=18, and of research subgroup DI-600 from n = 45 to n = 47 due to a slight shift in the datasets (i.e. participant questionnaires) now included in the fresh subgroupings. Note too, that this Dx boundary value adjustment has resulted in small differences in the means and confidence intervals for these two research subgroups which is, of course, due to the revised sample sizes. The graphic below reflects all of these small differences and we can now clearly identify all of the research subgroups that will be discussed throughout the remainder of the thesis:
Note that although the most important Dx boundary value has shifted to Dx = 592.5, research subgroup designations will remain annotated as '##600'. The summary table (below) sets out all of the research subgroups and their designations including additional minor subgroups that will be referred to occassionally throughout the Discussion section later. It is important to reiterate that the principal Academic Behavioural Confidence comparison will be between research subgroups ND-400, the BASE group; DNI, the TEST group; and DI-600, the CONTROL group.
Research Group Research SubGroup (n) Criteria ND ND-400 (44) students in research group ND who present a Dyslexia Index (Dx) of Dx ≤ 400 - the BASE group NDx400 (36) students in research group ND who present a Dyslexia Index (Dx ) of 400 < Dx < 592.5 DNI (18) students in research group ND who present a Dyslexia Index of Dx ≥ 592.5 - the TEST group DI DI-600 (47) students in research group DI who present a Dyslexia Index of Dx ≥ 592.5 - the CONTROL group DIx600 (19) students in research group DI who present a Dyslexia Index of 400 < Dx < 592.5
Close inspection of the datasets however, also revealed a number of students in research group ND who presented a Dyslexia Index of between Dx = 400 and Dx = 592.5 which is interesting because these respondents are presenting levels of dyslexia-ness that might be considered as a kind of 'partial' dyslexia, at least according to the criteria set in this research project. This research subgroup is designated NDx400 (n = 36). When considered in relation to the students in research group DI (= the students who had declared their dyslexia) who also returned a Dx value of between 400 and 592.5 (n = 19) we now have two further research subgroups of 'partial dyslexics' to explore - one group with no previously declared dyslexia-like differences and the other comprising students who have identified as dyslexic. Whilst the idea of 'partial dyslexia' demands further investigation this may be for a later development of this current research project. However, a cursory inspection of the other characteristics of students in these additional two research subgroups will be considered, especially to identify whether the dimensional profiles of students in each of these two, new research subgroups are similar or instead show significant dimensional differences which nevertheless account for the apparently elevated levels of dyslexia-ness of students in the non-dyslexic group and the equally depressed levels of dyslexia-ness of the comparable students with dyslexia. To help with this, example profile visualizations of the complete sets of dyslexia dimensions have been constructed to more readily identify similarities or differences and this process is discussed below.
Only two respondents in research group DI returned Dx values of Dx < 400 (339.92, 376.31) and these can be considered as outliers as these values fall well outside the conventional, +/- 3 standard deviations (standard error) of the estimated population mean Dx of this research group.
In conclusion, the process reported so far has demonstrated a robust approach towards exploring the nature of the Dyslexia Index metric in such a way as to justify its use in this project as the tool for finding students from amongst the research datapool who are not identified as dyslexic but who present dyslexia-like characteristics and study attributes in relation to their academic learning management strategies at university. This has enabled the three, key research subgroups to be clearly determined so that the examination of their respective levels of Academic Behavioural Confidence can be justifiably conducted.
4. Principal Component Analysis
Applying PCA to the datapool scales for Dyslexia Index and for Academic Behavioural Confidence
As outlined in the Research Methodology section, Principal Component Analysis (PCA) performs dimensionality contraction of data and hence is a valuable tool for determining whether scale items within a metric can be reduced into a set of factors, each effectively becoming a sub-scale in its own right. The main purpose of the analysis is to explain as much of the variance in the variables as possible using as few components (factors) as possible. However the process also enables an examination of the resulting sub-scales to be conducted which can be introduced into the analysis of the data to help in understanding how these components of the main metrics might interact with each other. This is important because by exploring these interactions, the ways in which aspects of dyslexia-ness might affect aspects of academic confidence may be more clearly revealed and hence, better understood.
Hence both the Dyslexia Index Profiler and the Academic Behavioural Confidence Scale have been reduced through PCA into a set of factors (components) and these have been assigned name-labels that reflect which dimensions of their parent metrics are their respective contributors. The software application SPSS has been used to work through the calculations and the report that follows distils the outputs generated from running these processes. As reported in the previous section, Sander & Sanders also applied a process of factorial analysis to their original, 24-item Academic Behavioural Confidence Scale and later, to their revised, 17-item Scale. With the exception of one study found to date (Corkery, 2011), all others that have used the ABC Scale in their research have utilized the Sander & Sanders factor structure for their analysis, had they chosen to explore their findings in the greater detail that the use of ABC factors permits. The original, together with Corkery's ABC factor structures have been investigated as part of my analysis development and reported elsewhere in this thesis (here), the outcome of which suggested that there would be merit in developing a factor structure that is unique to this project because the process may reveal an alternative set of project-specific factors for the Academic Behavioural Confidence Scale which could be more relevant for exploring the interrelationships between components of academic confidence and components of dyslexia-ness that are the focus of this enquiry.
Assumptions and preliminary work
In order to run a principal component analysis there are a number basic assumptions which need to be fulfilled:
The first is met through the study design for this project which is that the variables that comprise the two comparator metrics are continuous. This has been incorporated into the questionnaire design through use of continuous range input sliders as the mechanism for acquiring research participant response scores for the two scales, Dyslexia Index and Academic Behavioural Confidence which have been developed specifically to enable parametric statistical processes to be used in the data analysis. As alternatives to the more conventional, fixed anchor-point Likert-style scales which would have produced discrete data values leading to data outputs being arbitrarily coded, this design feature of the data collection tool thus supports a more robust statistical analysis.
The second assumption is that there needs to be evidence of linear relationships between the variables that comprise the scales. This is because PCA is based on Pearson correlation coefficients and it is considered that a scale-item variable that presents a correlation of r ≥ 0.3 with at least one other scale-item variable is worthy of inclusion in the analysis (Hinton et al, 2004). In the case of the Dyslexia Index, there are 20 scale item variables and for Academic Behavioural Confidence there are 24. An analysis of the inter-variable correlation matrix for both metrics showed that for Dyslexia Index, of the 190 possible correlation outcomes, 80 returned a correlation coefficient of r ≥ 0.3 with all variables bar one returning at least one correlation of r ≥ 0.3 with any other variable. For the Academic Behavioural Confidence Scale, of the 300 possible correlation outcomes, 138 returned a correlation coefficient of r ≥ 0.3 with all variables returning at least one correlation of r ≥ 0.3. Hence it is considered that the second assumption for applying a PCA to both metrics is met.
The third assumption is that there is sufficient sampling adequacy in the metrics for a principal component analysis to be run. A fundamental feature of PCA is a measure of the magnitude of the variance among the variables which might be common variance and hence, the lower the magnitude of common variance, the more appropriate the data is to factor analysis because each of the emerging factors will then be attributed to a proportion of the overall variance. Having adequate sample sizes is fundamental to this idea but this adequacy is a function of the total number of observations rather than to the sample sizes(s) per se. Statistical conventions indicate that a sample size of ≥ 150 observations is a sufficient condition (Guadagnoli & Velicer, 1988) although a later study suggests that aspects of the variables and the study design also have an impact on determining an appropriate level of sampling adequacy, recommending that this is improved with a higher number of observations (McCallum et al, 1999). Thus in this project, a total number of observations of between 3, and 4,000 for each of the two metrics is considered more than sufficient. The test for this assumption is straightforward using the Kaiser-Meyer-Olkin (KMO) measure of sampling adequacy. According to Kaiser's (1974) own classification this value can range from 0 to 1 with a value of KMO ≥ 0.5 considered to be desirable (Hinton el al, 2004, p342). For the Dyslexia Index metric, KMO = 0.866, which in Kaiser's classification is 'meritorious', close even to 'marvelous' (!), and for the Academic Behavioural Confidence Scale, coincidentally, KMO = 0.866 aswell. Additionally it is useful to examine the measures of sampling adequacy for individual variables to ensure that these also confirm the appropriateness for factor analysis. For the Dyslexia Index metric, the individual variable measures returned values of 0.605 ≤ KMO ≤ 0.919, and for Academic Behavioural Confidence, returned values of 0.753 ≤ KMO ≤ 0.929. Hence this third assumption for running a principal component analysis on both metrics is met.
The fourth assumption tests the null hypothesis that there are no correlations between any of the variables. If this null hypothesis were accepted, this would be indicating that the set of variables may not be reducible to a smaller number of components (factors), which is after all, the rationale for applying a principal component analysis to the data. The measure for testing this null hypothesis is Bartlett's Test of Sphericity and the output being sought is a significant result (p < 0.05) which will enable the null hypothesis that there are no correlations between any of the variable to be rejected. When applied to the Dyslexia Index metric, the test returned an output of p < 0.005, and when applied to the ABC Scale, the output was also p < 0.005. Hence for both metrics, the null hypothesis that there is no correlations between the metrics' variables is rejected, which means that there are correlations between the variables and therefore justification for running the PCA is present
Hence the preliminary assumptions have been met for running a principal component analysis on both the Dyslexia Index and on the Academic Behavioural Confidence Scale for the data collected in this enquiry.
Best expected PCA outcome
The key outcome of the factorial analysis of both metrics is that it has enabled a Dx Factor X ABC Factor matrix to be contsructed which, as expected, has revealed highly interesting and meaningful relationships between the components of the two metrics and this has contributed significantly to the discussion and final conclusions. The matrix and a more detailed report is presented below.
4.1 Factorial analysis of Dyslexia Index (Dx)
Dimensions of Dyslexia - in the order in which they appeared in the questionnaire:
Recall that the Likert scale that is attempting to evaluate levels of dyslexia-ness, the Dyslexia Index (Dx) Profiler, is a 20-item scale comprising scale items which attempt to evaluate the extent of each respondent's acquiescence with statements concerning specific aspects, that is, dimensions, of study, academic learning management and to an extent, learning history. The scale items were assembled in the questionnaire in a random order (left) and respondents were required to adjust the position of a slider control along a scale from 0 to 100% to register their degree of acquiescence with each of the statements. Each statement had its own slider. This process for recording participants' responses has been used throughout the earlier sections of the questionnaire. The design rationales are described in the previous section, 'Research Design' but the principal aim has been to mitigate the conventional Likert-style scale limitations imposed through fixed anchor-point selectors by generating a data output that can be considered as a measure of a continuous variable.
It is important to emphasize that the main function of factorial analysis in this project is to enable the factor sub-scales that emerge out of the Dyslexia Index metric to be related factor-by-factor to data acquired through the other main metric, Academic Behavioural Confidence (ABC) and its own factors (note that 'component' and 'factor' are used interchangeably throughout). The process of PCA determines that through interpretation of the output, scale-item dimensions of the Dyslexia Index scale will be assigned to only one factor - hence none will have cross-factoral influence, and likewise for ABC. Note that there is an element of 'best option' choice involved in this process as usually dimensions load on to more than one factor and a decision has to be made about determining which balance of options is the most interpretable. More of this below.
A significant further element of PCA is that it enables statements to be constructed which explain the proportion of variance that can be explained by each component and this can be usefully interpreted as the strength of impact that a component has on the complete results. This has been discussed in more depth in the previous section 'Research Design'. [Note to me: expand this a little in the RD section]
PCA has also been used to help to identify scale items that might be considered as redundant - that is, are not contributing to the evaluation of the construct in a helpful way and hence might be discarded. A process of inspection for scale-item redundancy has already been conducted through interpretation of the Cronbach's Alpha (α) internal reliability consistency analysis which has been thoroughly reported in the previous section, Research Design, however it is useful to provide a recap here as the outcomes contribute to this report on how the factors for Dyslexia Index (and ABC) have been established.
For the 20-item Dx scale used to collect participant data in the main research questionnaire, Cronbach's α = 0.842 which appears to be indicating a strong level of internal reliability consistency. As stated earlier, according to Kline (1986) however, a value α > 0.7 of does not necessarily strengthen this further and may instead be suggesting that some scale items can be removed to have little impact on the α-value and hence maintain the level of reliability of the scale without sacrifices possibly perceived as resulting from the subsequent reduced data acquisition.
When the potentially redundant Dx scale items were identified through this analysis and removed, the resulting 16-item scale returned a value of α = 0.889 which is indeed indicating that the internal consistency reliability of the scale is maintained and hence suggests that discarding these 4 scale items from the Dyslexia Index Profiler, thus reducing it to a 16-item scale, may have little impact on the overall Dx values.
The first iteration of this process which has regenerated 16-point Dyslexia Index Scale warrants further testing and this may be the focus of a follow-up study in due course, one element of which will be to explore the impact on α when combinations of the possibly redundant items are withdrawn. Suffice to say that effect size results for differences in ABC between research subgroups established through the 20-point Dx scale compared to those established through the reduced, 16-point Dx scale were only marginally different and so for this primary analysis, the full, 20-point scale has been used, pending the outcomes of the suggested follow-up study later.
Proportions of variance explained
Principal Component Analysis will produce as many components (factors) as variables and the process will 'explain' all the variance in each of the variables if all of the components are retained. Clearly the objective of the process is to decide how many factors are worth retaining in the final solution so that as much of the total variance as possible can be explained through all of these factors. Using the Eigenvalue-1 extraction criteria (Kaiser, 1960) which is the default setting in SPSS on account of this criteria being claimed as the most popular, five components (factors) emerged from the analysis output in SPSS which between them accounted for 60.4% of the total variance. Respectively these factors accounted for 31.7%, 9.9%, 7.6%. 6.0% and 5.3% of the total variance for Dyslexia Index. Inspection of the scree plot that was generated as part of the output suggested that retaining these 5 components (factors) would be appropriate although it can be seen both from the scree plot and from the table (right) that it is possible that a six-factor solution may be equally applicable because the initial eigenvalues for components 5 and 6 were both very close to 1, (1.06, 0.988), or even a four-factor solution may be the most appropriate as the eigenvalue for the fourth component in the 5-factor solution stood at a value of 1.20. To explore this, the principal component analysis was run twice more, firstly with a forced extraction of six components and secondly with four components. The six-component extraction produced an output where the last two components comprised just one dimension each and so this analysis was dismissed. The four-component extraction produced a highly similar output to the original, five-factor solution with just two dimensions being alternatively placed into different factors. Hence it was concluded that the five-factor solution can be accepted as a reasonable factor structure for the metric Dyslexia Index.
Identifying and labelling factors from the Table of Communalities
In interpreting factor analysis outputs, the Table of Communalities is the first result that is useful and from this, the groupings of dimensions into factors makes its first appearance. Five factors emerged and these have been labelled in keeping with the flavour of the dimensions which comprise them respectively:
Dx Factor: Reading, writing, spelling
Dx Dimensions:
- 20: gets anxious when asked to read aloud
- 8: when reading, repeats a line or misses out a line altogether
- 1: remembers thinking of themselves as slower at learning to read than their peers
- 6: in writing, frequently uses the wrong words for an intended meaning
- 9: in writing, struggles to put ideas into a sensible order
- 2: weak spelling
Dx Factor: Thinking and processing
Dx Dimensions:
- 15: considered by friends to be an innovative or creative problem-solver
- 17: regularly gets ‘lefts’ and ‘rights’ mixed up
- 18: often told by tutors that essays are confusing to read
- 11: prefers mindmaps and diagrams over lists or bullet points when planning assignments or writing
- 10: when at school, remembers mixing up similar-looking letters
- 19: gets muddled when searching for information
- 16: struggles when following lists of instructions or making sense of them
Dx Factor: Organization and time-management
Dx Dimensions:
- 5: considers themselves as a highly organized learner
- 3: finds time-management challenging
- 7: remembers appointments and arrives on time
Dx Factor: Verbalizing and scoping
Dx Dimensions:
- 14: prefers the big picture rather then focusing on detail
- 4: considers themselves better at explaining things verbally rather than in writing
Dx Factor: Working memory
Dx Dimensions:
- 13: finds following directions to get to places easy
- 12: is hopeless at remembering things, eg phone numbers
The communalities are the proportions of each of the variables' variances that is accounted for by the principal component analysis. So for example, for the first dimension in the table below 3.20: I get really anxious if I'm asked to read 'out loud', the communalities extraction value of 0.573 indicates that 57.3% of this dimension's variance can be explained by the factors (components). The loading is the correlation between the variable and the factor and this is(are) the figure(s) presented in line with each dimension in the respective factor column. According to research convention, serious attention is paid to loading factors of > 0.32 (Dewbury, 2004, p309) with Dewbury citing a reference to an earlier work by Comry & Lee (1992) which proposes that a loading of > 0.71 is 'excellent'. Note that in the table below, although loadings are calculated for all dimensions in all factors, only factor loadings > 0.3 are presented to enable the table to be more easily assimilated. Hence the row of data for dimension 3.20 only shows the one value of 0.829 for a loading onto Factor 1, Reading, Writing, Spelling because the loadings onto the other four factors are less than 0.3, and so forth for all dimensions and factors. The communalities extraction figure of 0.573 is thus the proportion of this dimension's variance that can be accounted for by all of the factors.
These communalities are reported alongside the Rotated Component Matrix which is a table that groups the 20 dimensions into the 5 components/factors, where in each component, dimensions are listed in descending order according to the loading onto each variable ( = dimension). The table indicates 'rotated' components which is the mathematical process that places the factors in the best (geometrical) position to enable easier interpretation. SPSS uses a Varimax' rotation, this being an 'orthoganal' process meaning that factors are forced to be independent of each other (rather than taking into account correlations between them). What emerges from this matrix (below) is that the factor structure is not quite as simple as would have been desirable because some dimensions load onto more than one factor, given the convention of a loading > 0.3 is indicating an influence that should be taken seriously. However, where this occurs, the troublesome dimension has been assigned to the factor onto which its loading is greatest - that is, where there is the greatest correlation between the dimension and the factor. Kline (1986), amongst other consulted, suggests that more often than not a single, simple factor structure is elusive and it should remains the task of the researcher to establish the most appropriate interpretation of the analysis that makes sense in the context of the project. This factor analysis for the Dyslexia Index Profiler seems reasonable and so for the purposes of the remaining analysis of the data collected in this project, this factor structure with the 20-point Dyslexia Index comprising 5 factors will be retained.
Rotated Component Matrix for Dyslexia Index, 20-point scale (Varimax Rotation) item # item statement = dyslexia dimension Factor Communalities 1 2 3 4 5 Extraction reading, writing, spelling thinking & processing organization & time-management verbalizing & scoping working memory 3.20 I get really anxious if I'm asked to read 'out loud' 0.829 0.573 3.08 When I'm reading, I sometimes read the same line again or miss out a line altogether 0.809 0.506 3.01 When I was learning to read at school, I often felt I was slower than others in my class 0.723 0.699 3.06 In my writing I frequently use the wrong word for my intended meaning 0.634 0.436 0.550 3.09 I have difficulty putting my writing ideas into a sensible order 0.609 0.337 0.321 0.639 3.02 My spelling is generally very good (reverse-coded data) 0.561 0.315 0.641 3.15 My friends say I often think in unusual or creative ways to solve problems 0.676 0.596 3.17 I get my 'lefts' and 'rights' easily mixed up 0.671 0.399 0.697 3.18 My tutors often tell me that my essays or assignments are confusing to read 0.427 0.663 0.685 3.11 When I'm planning my work I use diagrams or mindmaps rather than lists or bullet points 0.543 0.561 3.10 In my writing at school, I often mixed up similar letters like 'b' and 'd' or 'p' and 'q' 0.432 0.521 0.553 3.19 I get in a muddle when I'm searching for learning resources or information 0.479 0.508 0.335 0.673 3.16 I find it really challenging to make sense of a list of instructions 0.369 0.464 0.406 0.686 3.05 I think I am a highly organized learner -0.789 0.568 3.03 I find it very challenging to manage my time efficiently 0.786 0.519 3.07 I generally remember appointments and arrive on time -0.602 0.351 0.654 3.14 I prefer looking at the 'big picture' rather than focusing on the details 0.820 0.623 3.04 I can explain things to people much more easily verbally than in my writing 0.353 0.617 0.613 3.13 I find following directions to get to places quite straightforward -0.764 0.710 3.12 I'm hopeless at remembering things like telephone numbers 0.398 0.530 0.573
Dyslexia Index (Dx) Factors by Research Subgroup
The factorial analysis for Dyslexia Index has enabled strongly visual radar charts to be constructed which present an overview of the distribution of Dx factor values for students in each of the three research subgroups in the study. The three charts (below) display the factor profile for every student in these subgroups with profiles overlaid to generate a composite profile map for each subgroup. In ways that are much easier to spot than through inspection of the full data tables, these graphical representations of the five factor values for both each, and all students in each subgroup are revealing. Stark differences are evident between the factor profiles of non-dyslexic students in the Base subgroup (RG:ND-400) and dyslexic students in the Control subgroup (RG:DI-600). It is also apparent that the collective profile maps for students in the Test research subgroup, RG:DNI, are highly similar to the collective profile maps for students in the Control subgroup. In both of these subgroups students are presenting a Dyslexia Index value of Dx > 592.5 which is indicating that highly similar combinations of factor values are present in both subgroups, implying strong dyslexia-ness similarities between students with known dyslexia and the quasi-dyslexic students. Both of these are significantly different from the collective profile maps for students in the Base subgroup, RG:ND-400, (Dx < 400). Notably, in the chart for students in the strongly, non-dyslexic Base subgroup it is clear to see the noticeable skew away from the two Dyslexia Index factors, 'Reading, Writing, Spelling' and 'Thinking, Processing' but also more generally this profile map indicates reduced Dyslexia Index Factor values overall for students in this group in comparison with students with declared dyslexia and those non-dyslexics who appear to be presenting dyslexic characteristics. Aside from being highly revealing of differences at the factorial level which will be discussed below (sub-section 4.##), it is argued that this representation further demonstrate the validity of the Dyslexia Index Profiler as an effective discriminator for the purposes of this study. Each of these radar charts can be viewed in deeper detail in conjunction with each of the full data tables below.
The data tables collected here show a detailed summary of the factor values for every student in each of the three research subgroups of main interest. Two visualizations of each set of data values are available but it is clear to see how much easier it is to absorb the results collectively when presented as a radar chart in comparison to the scatter diagram of the same data which was the first attempt at visualizing the data.
[Respondents highlighted in green text in the tables are linked to their additional written commentaries submitted in the questionnaires and themes that have emerged in these will be included in the discussion of the results in the next section.]
Table 1: Dyslexia Index Factors for research subgroup DNIDyslexia Index Factors for research subgroup DNI - summary
open the panel to view the data
Dx overall Student respondents Dx Factor 1 Dx Factor 2 Dx Factor 3 Dx Factor 4 Dx Factor 5 research group ND
subgroup DNIReading, Writing, Spelling Thinking & Processing Organization & Time Management Verbalizing & Scoping Working Memory 684.75 means 763.01 647.60 635.53 734.64 668.82 76.55 / 18.56 st dev / st err 141.87 / 34.41 123.49 / 29.95 152.28 / 36.93 257.97 / 62.57 668.82 / 61.58 648 < μ < 721 95% CI for μ 696 < μ < 830 589 < μ < 706 563 < μ 708 612 < μ < 857 548 < μ <790
597.39 #75931558 916.77 432.65 489.60 634.84 609.76 604.94 #96408048 824.11 746.99 512.26 80.00 489.51 619.58 #61624105 505.49 549.41 706.84 812.97 1000.00 639.45 #16730769 583.02 714.22 483.05 1000.00 390.24 642.01 #20048355 567.20 718.86 568.08 852.27 500.00 642.02 #57371454 635.70 546.16 753.05 976.64 648.78 642.26 #97653577 694.09 559.57 712.99 816.33 472.93 654.84 #99268333 840.57 472.01 493.79 666.09 749.02 655.32 #63726872 570.07 771.58 500.00 466.41 800.00 656.90 #14557932 786.18 646.99 576.10 835.23 269.27 659.87 #78323952 700.81 621.80 518.70 938.91 316.10 682.51 #18801333 851.97 604.32 445.99 549.45 753.90 708.61 #21388930 878.05 613.15 755.14 336.95 1000.00 731.52 #87083069 895.96 647.76 851.19 1000.00 339.02 746.04 #10498881 903.14 527.08 705.65 933.44 1000.00 753.67 #68379308 819.43 788.45 611.81 549.53 884.63 779.07 #84526262 781.43 821.46 755.25 774.53 878.29 909.43 #28565915 980.17 874.41 1000.00 1000.00 937.32
Table 2: Dyslexia Index Factors for research subgroup DI-600
open the panel to view the data
Dx overall Student respondent Dx Factor 1 Dx Factor 2 Dx Factor 3 Dx Factor 4 Dx Factor 5 research group DI
subgroup DI-600Reading, Writing, Spelling Thinking & Processing Organization & Time Management Verbalizing & Scoping Working Memory 717.32 means 794.50 700.42 615.72 772.72 589.20 69.92 / 10.26 st dev / st err 106.33 / 15.68 131.07 / 19.32 145.72 / 21.49 165.11 / 24.34 227.14 / 33.49 697 < μ <737 95% CI for μ 764 < μ < 825 663 < μ < 738 574 < μ < 658 725 < μ < 820 524 < μ < 655
592.52 #32887925 756.18 332.24 458.14 794.45 725.61 595.04 #20726963 673.80 584.70 490.85 587.66 602.20 606.82 #10779962 618.41 455.34 461.30 763.28 509.76 616.91 #44789560 675.06 549.09 841.81 777.34 0.00 633.07 #61502858 674.11 554.91 515.25 944.53 573.17 634.44 #12595865 656.63 676.74 815.65 946.56 609.76 638.29 #95872552 500.00 500.00 500.00 500.00 500.00 641.94 #21789859 857.48 557.21 657.18 870.86 182.93 643.33 #44859855 790.31 634.68 506.78 691.09 0.00 653.86 #75137073 841.33 726.62 558.19 777.34 243.90 657.64 #50744483 816.86 692.21 464.18 786.25 628.78 665.17 #30598961 826.60 454.34 680.79 777.34 609.76 668.89 #69740230 685.51 703.20 829.94 500.00 665.85 669.98 #63170765 574.35 791.46 587.40 633.52 741.71 674.51 #67380181 699.88 598.26 730.96 899.92 981.71 679.93 #11098724 811.73 754.22 520.28 643.67 654.15 682.21 #67632469 795.15 689.66 763.39 919.84 70.00 690.70 #21694901 646.56 622.95 788.70 1000.00 882.93 698.65 #47581572 768.38 770.75 593.84 741.72 568.54 699.15 #74355805 935.42 796.00 473.90 679.38 531.71 702.32 #77173907 744.75 630.14 529.38 839.92 716.59 705.82 #41273845 835.32 655.16 744.63 1000.00 651.46 707.66 #21673654 875.96 808.45 462.60 632.11 573.90 716.10 #16359248 703.94 698.86 1000.00 459.92 140.24 719.63 #17465316 752.00 647.03 635.03 764.53 516.34 725.16 #78372084 756.29 797.72 312.43 644.53 609.76 728.64 #82550367 810.45 726.03 818.93 1000.00 869.51 735.19 #88952978 787.27 761.30 475.82 666.41 624.88 739.18 #56837694 839.45 778.70 588.64 510.00 556.83 745.66 #52594555 759.62 767.24 514.41 600.00 782.93 748.93 #90023507 809.69 729.06 468.64 772.11 662.20 751.23 #87564798 840.86 850.23 712.43 510.94 648.78 760.80 #38307943 974.01 616.62 760.40 911.25 637.07 763.09 #41496790 896.91 573.86 599.32 1000.00 609.76 768.97 #82055919 929.07 639.82 735.59 977.73 648.78 773.28 #22995924 784.61 871.28 474.86 973.28 644.88 778.04 #81973995 920.14 854.13 401.69 625.94 609.76 778.33 #49708220 844.13 772.37 696.21 549.69 585.37 778.46 #60363012 810.93 841.10 471.19 777.34 390.24 792.50 #87579284 909.41 715.75 488.14 888.67 875.12 796.62 #89059542 829.93 553.17 729.77 1000.00 1000.00 797.84 #74428045 811.09 903.93 567.34 568.59 747.80 797.98 #85897154 765.46 868.15 621.36 811.02 717.07 803.77 #77407616 975.06 817.24 667.80 777.34 420.73 807.36 #27618034 946.98 843.63 827.51 1000.00 604.39 835.65 #48997796 834.49 819.18 683.62 821.88 704.88 912.71 #69277072 989.74 934.93 713.73 1000.00 860.49
Table 3: Dyslexia Index Factors for research subgroup ND-400
open the panel to view the data
Dx overall Student respondent Dx Factor 1 Dx Factor 2 Dx Factor 3 Dx Factor 4 Dx Factor 5 research group ND
subgroup ND-400Reading, Writing, Spelling Thinking & Processing Organization & Time Management Verbalizing & Scoping Working Memory 304.00 means 276.43 214.38 586.78 458.02 377.68 67.48 / 10.29 st dev / st err 118.78 / 18.11 103.08 / 15.72 151.32 / 23.08 218.03 / 33.25 206.19 / 31.44 284 < μ < 324 95% CI for μ 241 < μ < 312 184 < μ < 245 542 < μ < 632 393 < μ < 523 316 < μ < 439
88.42 #91518540 33.25 21.92 470.40 177.50 93.66 147.64 #76211159 181.19 9.41 629.38 199.69 0.00 178.81 #12161792 205.70 35.96 435.42 465.78 177.07 204.02 #68941653 68.46 359.54 100.68 5.55 79.27 222.44 #36617000 199.67 182.01 490.00 339.14 182.44 228.69 #30986732 207.65 140.21 522.49 307.58 275.37 232.27 #73897011 252.59 173.63 716.50 129.14 139.02 252.21 #34115096 296.79 38.17 466.50 57.89 506.83 260.33 #41501454 170.07 124.89 590.96 589.06 636.59 261.48 #74011406 28.27 323.81 620.73 330.78 390.24 274.57 #24931735 326.37 123.29 823.73 222.66 403.66 275.97 #61231849 128.86 254.66 627.85 422.50 351.22 276.18 #23894998 294.30 198.97 627.01 522.97 324.39 278.34 #21853014 126.98 141.78 569.94 1000.00 210.73 281.77 #89902966 227.22 366.48 507.91 530.55 110.00 286.15 #25893877 147.65 92.58 797.51 622.03 361.22 301.01 #15789237 315.46 138.49 720.73 453.44 449.51 302.82 #30113372 80.67 278.31 583.62 642.50 440.24 306.04 #65118727 288.88 259.95 504.69 539.22 293.90 308.84 #41750383 228.60 340.37 494.24 397.58 609.76 319.07 #43052413 226.98 150.62 440.90 797.66 643.90 321.56 #33549302 269.74 365.80 626.05 389.06 390.24 323.37 #18703444 495.68 77.05 506.72 686.72 386.34 326.09 #94875457 380.55 132.24 499.66 666.41 526.59 327.60 #39284633 149.55 264.36 634.35 259.84 835.37 334.95 #69417357 441.69 315.07 493.22 366.41 78.05 335.35 #21274561 239.50 259.25 542.49 645.86 317.07 345.19 #43811153 264.96 205.02 557.91 722.27 478.05 345.22 #39243302 455.11 146.58 757.06 666.41 382.93 345.28 #79451676 450.86 146.89 462.37 477.81 628.54 346.15 #21294241 377.72 319.86 576.27 404.77 473.17 351.79 #72989831 298.57 231.74 557.63 855.78 151.22 363.39 #51781498 320.78 143.77 541.36 445.31 841.46 363.58 #21591730 393.59 289.50 393.22 340.08 239.02 365.29 #11270227 402.23 234.57 793.33 500.00 235.12 368.74 #96620843 367.93 223.79 817.80 504.45 684.15 369.12 #55702780 262.47 339.16 772.32 433.98 395.12 372.13 #97326352 433.42 327.10 340.11 356.48 286.59 375.31 #81902739 346.01 324.57 770.00 285.31 470.73 380.40 #52641377 388.27 232.40 974.46 778.13 129.51 383.65 #84596013 332.90 236.30 638.14 638.67 593.90 386.09 #46690418 412.57 210.27 665.76 500.00 695.12 397.08 #10697171 393.21 424.22 597.57 409.22 301.22
The matrix tables (Tables 13-15) explore these similarities and contrasts through a statistical process where the tables show a condensed view of the complete set of same Dx Factor mean value x same Dx Factor mean value combinations of research subgroups taken in pairs. The purpose of this is to present evidence of the significant or not significant differences between the Dx Factor means across the research subgroups as a first step towards a more detailed level of scrutiny of the subgroup differences in dyslexia-ness that have emerged.
Firstly, it is important to note that for all Dx factors, the t-Test reports no significant differences between the samples means for each factor when comparing the Test subgroup DNI with the Control subgroup DI-600. Hence respondents in the Test subgroup and the Control subgroup are presenting on average, similar Dx Factor mean values further implying that the Dyslexia Index metric appears to be successfully identifying students with dyslexia-like profiles from the research group of students with no reported dyslexia: that is, quasi-dyslexic students. Thus, the foundation is laid for comparing the Academic Behavioural Confidence between the Test and the Control subgroups. As added verification, it can be seen that the converse outcome is established between the Control subgroup and the Base subgroup (ND-400) where, with the exception of Dx Factor 3, Organization and Time Management, very highly significant differences between the Dx Factor means are recorded. This adds to the argument that overall, students from research group ND, which is students who declared no dyslexic learning difference, who comprised the Base subgroup of students who presented a Dyslexia Index of Dx < 400 - can be considered as properly presenting very low levels of dyslexia-ness. Hence, it is argued that the Dyslexia Index Profiler is presenting good discriminatory properties in accordance with its design rationale.
However for Dx Factor 3, Organization and Time Management, the mean Dx Factor values for all three research subgroups are not significantly different from each other which suggests that students at university who present very low levels of dyslexia-ness may be experiencing similar issues with organization and time management in their studies as do their dyslexia-identified- or not, peers. In their of students with dyslexia at university and in addition to presenting their own results, Mortimore & Crozier (2006), draw on prior research (Gilroy & Miles, 1996, McLaughlin et al, 1994) to evidence the difficulties experienced by dyslexic students in organizing their study processes and time-keeping. Whilst the outcomes of their study were consistent with the earlier research, their enquiry was conducted amongst students with dyslexia only and did not explore how the organization and time-keeping aspect of academic learning management may be referenced against students with no reported dyslexia. Hence the data summary presented here fills this gap in addition to being consistent with the findings of Mortimore & Crozier's study amongst students with dyslexia, demonstrated by the mean Dx Factor 3 of Dx = 635.53 for the strongly dyslexic students in this project. Hence this suggests that according to this metric's results and analysis, students who are strongly non-dyslexic in other areas may be just as 'dyslexic' in organizational and time-management skills at university as students with dyslexia. Viewing it another way, this is saying that most students at university tend to be disorganized and find time-management challenging, and that this aspect of academic learning management is not unique to students with learning differences. A reaction to this might be that if universities are motivated to ensure that all students across their learning communities become properly equipped to meet the learning challenges that they will be facing, then making early provision for upskilling students' organizational and time management competencies as part of the groundwork for enabling them to develop their academic learning management capabilities would be time well-spent.
Dx Factor Means Differences between the TEST subgroup (DNI) and the CONTROL subgroup (DI-600) Dx Factor 1 Dx Factor 2 Dx Factor 3 Dx Factor 4 Dx Factor 5 Reading, Writing, Spelling Thinking & Processing Organization & Time Management Verbalizing & Scoping Working Memory TEST Research Subgroup: DNI Factor Means Dx Factor CONTROL Research Subgroup: DI-600
Factor Means763.01 647.60 635.53 734.64 668.82 Dx 1 794.50 p = 0.3325;
no significant difference (5%)Dx 2 700.42 p = 0.1449;
no significant difference (5%)Dx 3 615.72 p = 0.6302;
no significant difference (5%)Dx 4 772.72 p = 0.4828;
no significant difference (5%)Dx 5 589.20 p = 0.2254;
no significant difference (5%)Dx Factor Means Differences between the BASE subgroup (ND-400) and the CONTROL subgroup (DI-600) Dx Factor 1 Dx Factor 2 Dx Factor 3 Dx Factor 4 Dx Factor 5 Reading, Writing, Spelling Thinking & Processing Organization & Time Management Verbalizing & Scoping Working Memory BASE Research Subgroup: ND-400 Factor Means Dx Factor CONTROL Research Subgroup: DI-600
Factor Means276.43 214.38 586.78 458.02 377.68 Dx 1 794.50 p < 0.0001;
very highly significant difference (0.1%)Dx 2 700.42 p < 0.0001;
very highly significant difference (0.1%)Dx 3 615.72 p = 0.3548;
no significant difference (5%)Dx 4 772.72 p < 0.0001;
very highly significant difference (0.1%)Dx 5 589.20 p < 0.0001;
very highly significant difference (0.1%)Dx Factor Means Differences between the BASE subgroup (ND-400) and the TEST subgroup (DNI) Dx Factor 1 Dx Factor 2 Dx Factor 3 Dx Factor 4 Dx Factor 5 Reading, Writing, Spelling Thinking & Processing Organization & Time Management Verbalizing & Scoping Working Memory BASE Research Subgroup: ND-400 Factor Means Dx Factor TEST Research Subgroup: DNI
Factor Means276.43 214.38 586.78 458.02 377.68 Dx 1 763.01 p < 0.0001;
very highly significant difference (0.1%)Dx 2 647.60 p < 0.0001;
very highly significant difference (0.1%)Dx 3 635.53 p = 0.2550;
no significant difference (5%)Dx 4 734.64 p < 0.0001;
very highly significant difference (0.1%)Dx 5 668.82 p < 0.0001;
very highly significant difference (0.1%)One outcome of the increasingly demonstrable robustness of its construct validity is that the Dyslexia Index Profiler, as it has been developed for this project more as a discriminator rather than an identifier, is showing not only merit as a screening tool for dyslexia - when dyslexia in higher education settings is framed in terms of parameters of academic learning management and study-skills - but possibly as a more widely available appraisal device in the toolkit for learning development and academic skills support services at university because it presents a readily comprehensible snapshot of any individual student's approach to study by generating a profile which identifies strengths that can be developed together with weaknesses that might be remediated. Warranted, further development would be requried.
Comparing differences in Dyslexia Index between research subgroups at a dimensional level
Further to examining differences in Dyslexia Index Factors, Dyslexia Index has been explored on a dimension by dimension basis as part of the process of trying to tease out which characteristics could be the more significantly responsible ones that might account for the differences in Academic Behavioural Confidence between the three research subgroups Test, Control and Base.
The summary table below lists all, 20 dimensions of Dyslexia Index (Dx) and shows the mean Dx levels firstly between the two, core research groups - students who declared their dyslexia, and students who declared no dyslexic learning difference; and secondly between the three research subgroups - the Control subgroup, the Base subgroup and the Test subgroup. Data in the top section of the table shows the mean Dx values for each dimension - recall that the Dx value indicates the level of respondents' acquiescence with the dimension statement. Note that the values are all 0 < Dx < 100 and that for each respondent in the research it has been the mean of the weighted aggregates of these dimensional values, scaled to 0 < Dx < 1000 which generates the respondent's overall Dyslexia Index (Dx). Underneath the actual mean values, both the t-test p-values and the Hedges 'g' effect size differences between pairs of groups and subgroups are shown. Aside from indicating the stark differences in the majority of the mean values between students with dyslexia and those without (RG:DI and RG:ND) when these data are further reduced into differences between the research subgroups, fascinating information is revealed. For example: looking at the differences in means for the TEST subgroup and the CONTROL subgroup for the two dimensions that together constitute the Dx Factor: Verbalizing and scoping it can be seen that the t-test output together with a medium-to-large effect size indicate significant differences.This may be evidence supporting the viewpoint that dyslexic students are likely to be academically more comfortable adopting planning strategies which permit a more holistic overview to be taken when approaching an assignment challenge rather than plan in lists or other linear-thinking ways (Draffen et al, 2007) - hence the widely adopted feature of UK Disabled Students' Allowance provision of concept-mapping assistive technologies such as the applications 'Inspiration' and 'Mind Genius'. Both of these software tools are designed to foster creative thinking, to facilitate ideas-brainstorming and pattern-spotting, and to enable the grass-hopper thinking of many dyslexic students to be developed into meaningful learning from which powerful knowledge structures can be built, ordered and converted into a linear writing process (Novak & Canus, 2010). Evidence has also shown that concept-mapping applications as learning technologies as opposed to assistive technologies are gaining traction in curriculum design, both as an additional and accessible learning tool (Nesbit & Adescope, 2006), as a mechanism for summative assessment (Anghel et al, 2010) and not least in higher education contexts as a means to promote flexible learning approaches (Goldrick et al, 2014), all of which are the embodiment of UDL. Additionally, and of high relevance to students presenting weak spelling competencies, whether attributed to a dyslexia or not, is evidence from studies concerning TEFL (Teaching English as a Foreign Language) learners where concept-mapping applications have been very successfully used to develop English-language spelling skills by enabling spoken phonemes to be connected with their written forms in a highly innovative and relationship-building format (Al-Jarf, 2011) and for connecting vocabulary to concepts in different contexts (Betancur & King, 2014).
Secondly, even more striking differences between dyslexic and non-dyslexic students for verbalizing ideas in preference to writing about them (Dimension 4) are evidenced where the Dyslexia Index dimension mean value of Dx=84.34 for the strongly dyslexic students in the Control subgroup contrasts sharply with the mean value of Dx=42.34 for the strongly non-dyslexic students in the Base subgroup. Indeed, it can be seen that for most of the dimensions, the differences in mean Dx values between dyslexic and non-dyslexic students (RG:DI and RG:ND) are equally salient with the largest absolute difference being for Dimension 20, I get really anxious if I'm asked to read out loud, with a Dx Index difference of 32.57 points (RG:DI Dx=77.40, RG:ND Dx=44.83) which corresponded to an effect size of 0.9654, conventionally categorized as 'large'. For the corresponding difference in mean Dx values between the strongly dyslexic and strongly non-dyslexic research subgroups, we see an even more substantial absolute difference of 62.11 Dx Index points (RG:DI-600 Dx=83.38, RG:ND-400 Dx=21.27) which is as we would expect given that dyslexia is conventionally considered as principally associated with reading difficulties. This considerable absolute difference in Dx points is echoed for Dimension 1, When I was learning to read at school I often felt I was slower than others in my class, where an even greater difference of 65.29 Dx Index points is recorded (RG:DI-600 Dx=78.34, RG:ND-400, Dx=13.05).
Notable differences which emergefrom the data for Dimensions 2, My spelling is generally good (weak), 17, I get my 'lefts' and 'rights' easily mixed up and 10, In my writing at school, I often mixed up letter that looked similar: Students with declared dyslexia in the Control subgroup present significantly higher Dx mean values than for their peers in the Test subgroup (Dx=75.45 / 49.17; Dx=75.28 / 57.78; Dx=67.17 / 45.33 respectively). For Dimension 2, spelling, this may be indicating that weak spelling is not a characteristic of students in the Test subgroup where in most other respects, these students are presenting dimensional levels of dyslexia-ness that are at similar levels to their identified dyslexic peers. This might be a reason to explain why students in the Test subgroup who might otherwise be considered as unidentified dyslexics have not had their dyslexic learning differences previously spotted in their learning careers as weak spelling can be an early indication pf dyslexia.
Looking across the complete set of dyslexia dimensions, the outcomes that emerge when the Test and the Control subgroups are compared show that in all but 4 of the 20 dyslexia dimensions, the mean values for each of the dimensions respectively are very similar which is supported by generally small effect size differences and p-values which indicate no significant differences between the means. This outcome is suggesting that the students in the Control subgroup who are presenting dyslexia-like profiles are indeed dyslexic within the terms of reference of the Dyslexia Index Profiler. This adds to the construct validity of the Dyslexia Index metric as a mechanism for discriminating students who may be dyslexic amongst the research group of students who declared no dyslexia. Thus confidence is gained in using the measure as an index of a construct that is not directly observable (Weston & Rosenthall, 2003), in this project, termed 'dyslexia-ness'. Smith (2005) summarizes the seminal work of Cronbach & Meehl (1955) on construct validity which comprehensively argues 'that the only way to determine whether a measure reflects a construct validly is to test whether scores on the measure conform to a theory, of which the target construct is a part' (op cit, p405) and it is argued that by exploring the contrasts in Dx Index values at a dimensional level and commenting on the extent to which the differences that have been measured are in keeping with the more widely accepted theoretical underpinnings of at least some of the typically observed characteristics of dyslexia, the construct validity of the Dyslexia Index Profiler is strengthened and justified as the discriminator for which it was designed in this project.
Differences in mean value dyslexia dimensions Dx Factor: 1: Reading, writing, spelling 2: Thinking and processing 3: Organization & time-management 4: Verbalizing & scoping 5: Working memory Dimension #: 20 8 1 6 9 2 15 17 18 11 10 19 16 5 3 7 14 4 13 12 Dimension statement
I get really anxious if I'm asked to read out loud When I'm reading I sometimes read the same line again or miss out a line altogether When I was learning to read at school, I often felt I was slower than others in my class In my writing I frequently use the wrong word for my intended meaning I have difficulty putting my writing ideas into a sensible order My spelling is generally good (weak*) My friends say I often think in unusual or creative ways to solve problems I get my 'lefts' and 'rights' easily mixed up My tutors often tell me that my essays or assignments are confusing to read When I'm planning my work I use diagrams or mindmaps rather than lists or bullet points In my writing at school, I often mixed up letters that looked similar I get in a muddle when I'm searching for learning resources or information I find it really challenging to make sense of a list of instructions I think I'm a highly organized learner I find it very challenging to manage my time effectively I generally remember appoint-ments and arrive on time I prefer looking at the big picture rather than focusing on the details I can explain things to people much more easily verbally than in my writing I find following directions to get to places quite straght forward I'm hopeless at remembering things like telephone numbers * 'good' in the research QNR and data was subsequently reverse coded to indicate a level of spelling weakness DI means 77.40 83.72 68.69 66.40 80.00 67.19 72.46 64.99 57.10 51.49 53.54 65.81 51.76 44.13 65.43 64.59 64.40 73.38 46.13 63.09 NDmeans 44.83 53.65 39.69 40.93 50.85 35.80 53.89 35.59 33.47 37.48 18.81 44.07 37.52 46.59 60.02 68.27 53.80 54.49 56.16 43.99 DI-600 means 83.38 88.26 78.34 78.77 88.13 75.45 73.55 75.28 63.70 62.51 67.17 74.74 58.79 43.32 66.45 68.51 68.47 84.34 42.40 69.49 ND-400 means 21.27 29.61 13.05 21.61 27.91 23.80 44.32 21.77 14.93 23.98 6.52 23.98 19.18 46.59 52.61 73.43 50.11 42.34 53.39 27.77 DNI means 71.78 83.83 73.50 72.28 84.44 49.17 79.17 57.78 68.72 62.06 45.33 78.06 65.44 52.72 70.00 63.78 66.50 79.06 65.22 67.94 TTest p-values: ND & DI <0.0001 <0.0001 <0.0001 <0.0001 <0.0001 <0.0001 <0.0001 <0.0001 <0.0001 0.0047 <0.0001 <0.0001 0.0016 0.2997 0.1373 0.2176 0.0079 <0.0001 0.0390 0.0003 Hedges 'g' ND & DI 0.9654 1.0607 0.7944 0.8688 0.9878 1.0359 0.6841 0.7978 0.7663 0.4152 1.0700 0.7116 0.4711 -0.0831 0.1730 -0.1235 0.3853 0.6045 -0.2798 0.5585 TTest p-values: ND-400 & DI-600 <0.0001 <0.0001 <0.0001 <0.0001 <0.0001 <0.0001 <0.0001 <0.0001 <0.0001 <0.0001 <0.0001 <0.0001 <0.0001 0.2974 0.0197 0.2018 0.0007 <0.0001 0.0744 <0.001 Hedges 'g' ND-400 & DI-600 2.3640 2.6920 2.6505 2.7797 2.6841 1.9816 1.1330 1.6556 1.9271 1.2349 2.1755 2.0787 1.5492 -0.1120 0.4385 -0.1761 0.6926 1.8652 -0.3055 1.3747 TTest p-value: DNI & DI-600 0.0539 0.1543 0.2836 0.1431 0.1960 0.0007 0.2071 0.0291 0.2587 0.4778 0.0138 0.3056 0.2078 0.1343 0.3346 0.2801 0.3938 0.2012 0.0173 0.4341 Hedges 'g' DNI & DI-600 -0.4521 -0.2846 -0.1594 -0.2982 -0.2389 -0.9299 0.2278 -0.5346 0.1805 -0.0155 -0.6255 0.1416 0.2272 0.3094 0.1190 -0.1624 -0.0750 -0.2337 0.5986 -0.0462 p < 0.05 g ≥ 0.7 0.5 ≤ g <0.7 0.3 ≤ g <0.5
4.2 Factorial analysis of the Academic Behavioural Confidence Scale
The process of Principal Component Analysis has also been applied to the data collected on Academic Behavioural Confidence and likewise this has been conducted through the software application SPSS.
This has been prompted because a revised, 17-item ABC Scale had been established by Sander & Sanders (2009) following a re-inspection of the combined data from several of their earlier studies where ABC had been measured, and this was developed through PCA on data collected through their original 24-item scale. Their (relatively) large composite dataset (n = 865) was generated by aggregating data collected from five earlier studies conducted between 2001 and 2006 collecting psychology undergraduates from one university in South Wales (n=507) with a further dataset of ABC values obtained from first-year medical students at one HE institution in The Midlands collected in 2001 (n = 182) and an additional dataset of health care students from a new university in South Wales attending 6 different courses ranging from podiatry to dental health care (n = 176). The two, smaller of these three datasets are of a similar size to the number of respondents in this current project (n=166).
It is of note that there are both differences and similarities in the cohorts of students in Sander & Sanders' (S&S) combined dataset when compared with features of my dataset. For example, one difference was that in the Sander & Sanders studies, students were all undergraduates from a broadly similar family of academic disciplines which may be considered as a limitation because some components of study skillsets might reasonably be expected to differ according to the academic discipline being studied. In the S&S studies it is likely that this may be due to convenience sampling rather than through research design and does not necessarily reflect on the quality of the data collected, although a consequence could be that results obtained may lack generalizability across the wider student community. Whereas in my study students across the university community were invited to participate in the research, with the participation response producing an overall ratio between undergraduates and other students of 75% : 25%. ('undergraduates' includes students attending foundation or access courses and 'other students' comprises post-graduates, research students and a very small number of others who did not disclose their study level (3)). In the Sander & Sanders' datasets, students were drawn from a narrow range of subject specialisms whereas in my study, subjects studied at university was not recorded so it is reasonable to assume that students from a range of curriculum specialisms are as likely to have participated as not. Thus, analysis outcomes from my study are likely to be a good cross-sectional representation of the constructs being explored from across the complete student community, albeit through data acquired largely from just one institution. One similarity was that in Sander & Sanders' datasets, students' previous academic achievement at A-level was recorded with the complete range of grades being presented and although this data was not requested in my study it is not unreasonable to suppose that students who responded to the invitation to participate presented an equally wide range of prior academic achievement.
The original Academic Confidence Scale (ACS) was formulated to operationalize an enquiry to explore stark differences in confidence observed between two very different student groups (Sander & Sanders 2003). The data collected was factor-analysed to reveal 6 subscales: Studying, Understanding, Attendance, Grades, Verbalizing and Clarifying although it was pointed out that this resulting factor structure was a best-compromise solution as some statements in the ACS did not load on to only one factor, which would be the ideal outcome for a principal component analysis. The ACS was renamed shortly after its inception to the Academic Behavioural Confidence Scale to acknowledge that the scale was in fact more sharply focused on measuring students' 'confidence in actions and plans related to academic study' (Sanders & Sander, 2007, p635). The later, factor analysis of the aggregated data demonstrated that this revised scale consisted of 6 factors: Studying, Understanding, Attendance, Grades, Verbalising, and Requesting which was deemed a better representation of the subscale structure than the earlier 6-factor analysis following a more detailed, Confirmatory Factor Analysis. Note that only the earlier factor 'Clarifying' was superseded by the later factor 'Requesting' so it might appear that differences between the factor structures are minimal. However as the factor loadings table of the earlier PCA is not published, it is not possible to comment on how scale item loadings may have shifted in generating the later factors despite 5 of the six factors retaining the same factor labels. An additional significant outcome of the later factor analysis was to identify some scale-item redundancy which led to 7 scale items being removed from the original, 24-item ABC Scale. A further factor analysis was then conducted which revealed a new factor structure with scale items loading onto only 4 factors, these being described as: Grades, Verbalizing, Studying and Attendance.
The data collected in this project has been acquired through the complete, original 24-scale-item scale and since Sander & Sanders' 17-point scale was revised by merely omitted some scale items leaving the others exactly as they had been in the earlier, 24-item scale, it has enabled both ABC-24 and ABC-17 outputs to be generated from my local data. The table below presents these outputs for comparison:
Research Group Research subgroup n ABC24 mean ABC24 sd ABC17 mean ABC17 sd DI CONTROL (RG:DI-600) 47 57.89 15.24 57.49 15.75 Hedges' g effect size / Student's t-test p-value: DI-600:DNI: g = 0.483 / p = 0.041 g = 0.521 / p = 0.032 ND TEST (RG:DNI) 18 64.92 12.43 65.24 12.26 BASE (RG:ND-400) 44 72.15 12.35 72.25 12.66 This reveals little difference between the mean ABC24 and mean ABC17 values for any of the three, principal research subgroups, showing that a slightly greater effect size is generated between the TEST subgroup and the CONTROL subgroup using the 17-point ABC Scale. In both cases (ABC24 and ABC17) Student's t-test reveals that a significant difference (p < 0.05) is present between the sample means (one-tail test, 5% level) of the TEST and the CONTROL subgroups which is an outcome that supports a rejection of the Research Null Hypothesis that there is no difference in Academic Behavioural Confidence between the TEST subgroup and the CONTROL subgroup.
Comparing ABC24 and ABC17 outputs
I, it is unusual to be able to use two, so closely related versions of a metric to evaluate the same construct and reflecting on this, first of all identified the merit of applying a statistical test to try to determine whether or not there is a significant difference in the effect size outputs that the two versions have generated for this local data. Should the result indicate no significant difference between the effect sizes, this would imply that whichever version of the metric were used, the broader outcomes would be the same, statistically at least. To date, no literature has been found where this idea has been converted into a workable statistical process that might be followed as an exemplar or to offer guidance about how a comparison of effect sizes in this context might be achievable, especially since the distribution of effect sizes is unknown. But it is possible to calculate a confidence interval for the population Cohen's 'd' effect size, 'δ', this being an effect size measure of which Hedges 'g' is a slightly more refined version. From this it may be possible to broadly establish whether these two effect sizes are in fact statistically the same. The Confidence Interval calculation process for Cohen's 'd' that is accessible (Cumming, 2012) generates the confidence interval for the estimated population effect size and when using the ABC24 Scale on my data Cohen's 'd' effect size difference between the ABC mean values between the Test and the Control subgroups emerged as -0.068 < δ < 1.032, and for the ABC17 mean values, -0.032 < δ < 1.070. Given the very close match between these two confidence intervals (wide as they are) this is suggesting that to all intents and purposes, the difference in effect sizes when using ABC24 compared with using ABC17 is marginal. Sander & Sanders claim that the criterion validity of the ABC Scale is enhanced through their factor analysis procedure and the subsequent reduction into a 17-point scale where criterion validity is presumed to refer to predictive criterion validity although with my data at least, given the negligible variation between effect size differences when using the 17-point or the 24-point scale, it is not possible to argue the same point. Secondly, and as a further ‘bootstrap’ to explore whether significant differences in outputs from the ABC24 and ABC17 point scales existed, a somewhat contrived adaptation of the t-Test was applied. Although not strictly meeting the criteria for the application of this test, by treating the ABC24 and ABC17 point scales as equivalent to a pre- post-intervention examination of observable differences in outputs for the same sample – in this case, the complete datagroup - a paired-samples t-test could generate an output worthy of interpretation. On running this test, Q-Q plots showed distributions closely aligned with the leading diagonal indicating that normality could be assumed (Figure 29). The t-test itself indicated no significant differences between the outputs of the ABC24 and ABC17 point scales (t=-0.099, p=0.921, 2-tailed test).
Much has been drawn from the statistical rigour that Sander & Sanders have demonstrated to justify the robustness of their Academic Behavioural Confidence Scale and given the growing reputation that the metric is gaining as a well-proven and valid scale for exploring various aspect of academic confidence amongst university students (eg: Nicholson et al, 2013, Matoti & Junquiera, 2009, Hlalele, 2010, Taylor & House, 2010, Stevenson, 2010, Matoti, 2011, Chester et al, 2010, Willis, 2010, Chester et al, 2011, Wesson & Derrer-Rendall, 2011, Hlalele & Alexander, 2011, Keinhuis et al, 2011, Newstead, 2011, Aguila Ochoa & Sander, 2012, Hlalele, 2012, McLafferty et al, 2012, Kienhuis, 2013, Putwain et al, 2013, de la Fuente et al, 2014, Takahashi & Takahashi, 2015, Marek et al, 2015, Sanders et al, 2016, Braithwaite & Corr, 2016, Putwain & Sander, 2016), it is being used in this project without hesitation as the best metric available for exploring the issues being addressed by the research hypotheses.
However in the interests of trying hard to ensure that analysis of the ABC Scale's output is scrutinized very carefully and contextually in respect of the datapool that has generated the results, combined with Sander & Sanders' precedent for investigating the factor structure of the ABC Scale, there are reasonable grounds for conducting PCA on this project's local data. This will be to determine whether a similar or a different factor structure (to the S&S ABC17 or ABC24 point scales) emerges and which may then be more acutely integrated with the datapool's output for the factor structure of Dyslexia Index Profiler accordingly. Additionally, the possibility should be considered that there may be an unwitting bias in Sander & Sanders' analyses due to students being all undergraduates and all from similar subject specialisms which may mean that the factor structure of the ABC Scale as determined by their PCA has its best accuracy when applied to data collected from a student demographic that is reasonably comparable to their studies'. Whereas in this project, no data was collected about students' subject specialisms nor their levels of study and so drawing research conclusions based on outputs from analysis of data collected from my more broad-based source from the subscales of the existing ABC24 Scale's 6-factor, or the ABC17 Scale's 4-factor structure could be questionable. This cautious approach is partly to demonstrate an awareness of the need for data analysis processes to be as relevant and applicable as possible. But it is also a consequence of earlier attention drawn (sub-section 2.##) to an example of the reportedly disappointing effectiveness of a construct-evaluating metric developed from a closed cohort sample at a single university when used to explore the same construct as presented in a sample taken from a different university's student community (the YAA Adult Dyslexia Scale; (Hatcher & Snowling, 2002) which was adapted for use in an Australian university with disappointing results (Chanock et al, 2010)). Chanock's highlighted the limitations of the YAA due to its development being based entirely on data collected from a single source arguing that this reduced its adaptability for use in outwardly similar contexts but where, in this case, significant differences in test-subject demographics appeared sufficient to upset the results.
Hence the specific factor structure that is revealed through PCA locally is almost certainly likely be more appropriate for use in the project's comparative analysis with the Dyslexia Index metric, rather than relying on outputs from the factor structure and revised 17-item ABC scale determined from the Sander & Sanders' collection of studies. It is reasonable to suppose that Corkery et al (2011) followed a similar line of reasoning to justify applying principal component analysis to the local data in their study and the factors which emerged showed differences in comparison to both the Sander & Sanders (S&S) factor structures for both the 24-scale-item and the 17-scale-item ABC Scales and indeed to the factor loadings and subscales which emerged from the PCA on my data. Hence we see an emerging precedent for applying PCA to local data within a research project in order to examine the outputs generated from the application of the Academic Behavioural Confidence Scale, at the very least in order to compare the resulting factor loadings and subscales with outputs generated from the existing, Sander & Sanders ABC subscales. Unfortunately this does raise an issue about the stability and hence the generalizability of ABC factors per se and suggests that researchers choosing to use the metric in their studies may be wise to explore the factor structre of the ABC Scale in relation to their local data unless it could be shown that the demographics of their research cohorts may closely resemble those of Sander & Sanders' original (combined) studies. On a more general point but also in line with Chanock's (2010) observations in respect of the York Adult Assessment (for dyslexia) and using evaluatative metrics developed entirely from one single institution's local datapool in a different institution, this suggests that research outputs may be more robust were researchers more inclined to extend their data analysis procedures to include principal component analysis on their local data when using metrics developed elsewhere.
The Principal Component Analysis applied to the 24-scale-item Academic Behavioural Confidence Scale used to acquire this project's data has resulted in 5 factors being identified. However, just as for the factorial analysis conducted on the Dyslexia Index scale, it can been seen from the Rotated Component Matrix (below) that the factor structure that emerged from this analysis of the ABC Scale was not as simple as is desirable because a few dimensions (that is, ABC scale items) loaded on to more than one factor. By applying an element of best reasonable judgement, it is considered that there is justification for accepting the outcomes and in accordance with the nature of scale items that emerged as sensibly loading onto each of the 5 factors, these have been categorized as:
- ABC24 Factor 1: - Study Efficacy
- ABC24 Factor 2: - Engagement
- ABC24 Factor 3: - Academic Output
- ABC24 Factor 4: - Attendance
- ABC24 Factor 5: - Debating
Rotated Component Matrix for Academic Behavioural Confidence 24-point scale item # item statement Factor Communalities ABC 1 2 3 4 5 Extraction study efficacy engagement academic output attendance debating 121 - plan appropriate revision schedules 0.809 0.761 101 - study effectively in independent study 0.703 0.637 104 - manage workload to meet deadlines 0.695 0.593 113 - prepare thoroughly for tutorials 0.665 0.578 122 - remain adequately motivated throughout my time at university 0.639 0.555 119 - make the most of university study opportunities 0.637 0.570 114 - read recommended background material 0.602 0.318 0.530 103 - respond to lecturers' questions in a full lecture theatre 0.799 0.662 110 - ask lecturers questions during a lecture 0.774 0.707 112 - follow themes and debates in lectures 0.654 0.610 105 - present to a small group of peers 0.624 0.483 102 - produce your best work in exams 0.605 0.444 0.692 111 - understand material discussed with lecturers 0.597 0.516 117 - ask for help if you don't understand 0.454 0.406 116 - write in an appropriate style 0.819 0.736 115 - produce coursework at the required standard 0.814 0.805 107 - attain good grades 0.383 0.740 0.740 120 - pass assessments at the first attempt 0.696 0.593 123 - produce best work in coursework assignments 0.492 0.511 0.344 0.649 106 - attend most taught sessions 0.812 0.739 124 - attend tutorials 0.772 0.675 118 - be on time for lectures 0.676 0.522 108 - debate academically with peers 0.435 0.640 0.652 109 - ask lecturers questions in one-one settings 0.321 0.346 0.632 0.624 The output from the analysis conducted in the application SPSS, also indicated a Kaiser-Meyer-Olkin measure of sampling adequacy of 0.866, regarded as 'meritorious' (Kaiser, 1974), which confirms that conducting principal component analysis has been a useful technique to undertake; and the Bartlett test of sphericity for the null hypothesis that there are no correlations between any of the variables showed a level of significance of p < 0.0005 which is a highly significant result, indicating that this null hypothesis is to be rejected and that there are correlations between variables so that applying PCA to the data is likely to reveal a useful factor structure.
Proportions of variance explained
As outlined above for the principal component analysis conducted for the Dyslexia Index metric, the process attempts to account for all the variance in each of the variables if all of the components are retained. Using the same, Eigenvalue-1 extraction factor, the five components (factors) which emerged from the analysis of the ABC24 Scale accounted between them for 62.6% of the total variance with the most significant influence being from Factor 1, study efficacy which explained 35.0% of the total variance.
Consistent with this Table of Variances Explained, it can also be seen from the factor loadings table above (Rotated Component Matrix) that in terms of the number of scale items loading on to factors, the strongest influence to Academic Behavioural Confidence overall appears to be attributable to Factors 1 and 2, study efficacy and engagement respectively, and to a lesser extent, Factor 3, academic output. Given the foundations of the ABC Scale being firmly rooted in Bandura's Social Cognitive Theory and all it says about self-efficacy where it has been demonstrated that mastery experience is one of the key contributors, it is pleasing to note that these three factors are strongly indicative of the relationship between academic confidence and academic learning management processes, success in which might be argued as strong evidence of a learner's developing academic mastery.
But this table of factor loadings also shows the significance that developing strong academic writing styles has on academic confidence with a factor loading of 0.819 being the highest of all 24 loadings. Where this impacts on students presenting high levels of dyslexia-ness is that clearly while education systems remain steadfastly rooted in literacy competencies with academic outputs based on writing skills being the principal form upon which assessments of academic capabilities are gauged, students with a dyslexia that has not been strategically ameliorated, whether unknowingly or through learning support and development, will continue to be disadvantaged. This is a significant point and returns again to my argument in support of Universal Design for Learning where access to learning becomes more adaptable to learner needs and less constrained by conventional and traditional processes for the transmission of knowledge and the expression of ideas, all discussed in an earlier section.
Comparing factor structures
It is useful to consider this factor analysis in the light of that of Sander & Sanders (2009) study, reproduced below. An attempts has been made to compare the grouping of dimensions into factors that emerged from their PCA to the PCA on this project's local data, indicated by what has been termed the 'closest map'. This is where dimensions from both the S&S PCA and my own PCA result in similar dimensional groupings. It has been necessary of course to revert back to Sander & Sanders original 24-item scale to make this comparison. It can been seen that the first four factors of both analyses present similar loadings and groupings of dimensions although Sander & Sanders' factors 5 and 6 draw no obvious mapping to the factor that have emerged out of my PCA.
Rotated Component Matrix for Academic Behavioural Confidence 24-point scale (adapted from: Sander & Sanders, 2009, p25) item # item statement Factor ABC 1 2 3 4 5 6 Sander & Sanders' factor designations: studying verbalising grades attendance understanding requesting closest map to ABC24(5) in my data: study efficacy engagement academic output attendance no mapping no mapping 121 - plan appropriate revision schedules 0.80 101 - study effectively in independent study 0.72 122 - remain adequately motivated throughout my time at university 0.62 104 - manage workload to meet deadlines 0.56 103 - respond to lecturers' questions in a full lecture theatre 0.85 105 - present to a small group of peers 0.81 108 - debate academically with peers 0.67 110 - ask lecturers questions during a lecture 0.58 120 - pass assessment at the first attempt 0.83 115 - produce coursework at the required standard 0.74 116 - write in an appropriate style 0.67 107 - attain good grades 0.66 123 - produce best work in coursework assignments 0.55 102 - produce best work in exams 0.51 124 - attend tutorials 0.86 106 - attend most taught sessions 0.82 118 - be on time for lectures 0.40 119 - make the most of university study opportunities 0.17 0.24 0.29 0.21 113 - prepare thoroughly for tutorials 0.73 112 - follow themes and debates in lectures 0.72 111 - understand material discussed with lecturers 0.68 114 - read recommended background material 0.68 109 - ask lecturers questions in one-one settings 0.85 117 - ask for help if you don't understand 0.83 It is of note that scale item 119 was not attributed to any of Sander & Sanders' factors with the highest loading of just 0.29 with the factor 'attendance'. The extraction commonalities was not published in Sander & Sanders 2009 paper from which this data has been drawn.
A cursory inspection of the two tables side-by-side shows that:
- My Factor 1, 'study efficacy' includes all four dimensions in S&S Factor 1: 'studying', with two of the remaining 3 dimensions attributed into S&S Factor 4, 'understanding' and the final dimension, 119, 'make the most of university study opportunities' being unattributed in the S&S analysis; however with a loading factor of 0.637 in my data, this dimension should clearly be included in my Factor 1. Where Sander & Sanders designate these dimensions into two factors 'studying' and 'understanding', these two factors together map to my Factor 1, so aspects of academic confidence at university that Sander & Sanders call 'studying' and 'understanding', I call 'study efficacy'. Sander & Sanders renamed their Scale as a measure of Academic Behavioural Confidence. so the dimension 111 'understand material discussed with lecturers' might be at odds with the revised rationale for the scale which is to assess actions and plans related to academic study because to understand is more of an executive, cognitive function rather than a behavioural one. Indeed the S&S Factor 'understanding' is perhaps inappropriately named for this same reason not least as the other dimensions in this factor are more action-oriented. Dimension 111 is one of the 7 dimensions of my Factor 2 engagement which is arguably a better place for this dimension because participants in this project at least have focused more on the interactional process with their lecturers implied in this dimension's stem statement rather than the cognitive process of understanding.
- 3 of S&S's 4 dimensions in their Factor 2, 'verbalising' map to to the same 3 out of 7 dimensions in my Factor 2, 'engagement'. S&S include dimension 108 'debate academically with peers' into their Factor 2 whereas I attribute this dimension to my Factor 5, 'debating'. Two further dimensions in my Factor 2 are attributed in the S&S analysis to their Factor 4, 'understanding' so this is suggesting that the S&S Factors 'verbalising' and 'understanding' when taken together make a close map fo my Factor 2 'engagement'.
- In S&S Factor 3, 'grades', 5 out of the 6 dimensions in this factor also appear in my Factor 3, 'academic output' so this is a close mapping between the two factors. The additional dimension, 'produce best work in exams' in S&S Factor 3 however, presented a higher loading with Factor 2, 'engagement' in my analysis.
- My Factor 4, 'attendance' contains exactly the same 3 dimensions as S&S Factor 4, 'attendance' so there is an exact mapping here.
- S&S designated a Factor 6, 'requesting' which contained dimensions 109 and 117, 'ask lecturers questions in one-one settings' and 'ask for help if you don't understand' whereas the former of these (109) is grouped with dimension 108, 'debate academically with peers' in my PCA with these two dimensions alone forming the final Factor 5, 'debating' in my analysis, so this acknowledges more of a dialogical interactional relationship between not only students and their peers, but also with their academic staff.
In summary, it can be seen from this brief discussion relating to differences and similarities between the assignment of dimensions into factors according to the PCA conducted on my local data in comparision to the Sander & Sanders analysis, that there appears to be merit in the application of a local principal component analysis on data collected through the Academic Behavioral Confidence Scale but perhaps only where the metric is being used in conjunction with another evaluator - in the case of this study, Dyslexia Index. Tops et al (2012) in a discussion about how to identify dyslexia in higher education students argued in support of the generalizability of a new model for exploring meaning in data rather than accepting that the model may only be valid for the data from which it is derived (ibid, p7) and although the reference was more so part of a point relating to post hoc discriminant analysis where tests are applied to data first, followed by an interpretation about partipants may subseqently be classified, it is relevant here because in transferring the point to this context, this is perhaps suggesting that the ABC Scale, at least in terms of its factorial components, remains at an early stage of development. This is not least as the discussion above has shown that the establishment of a factor structure for the scale as an outcome of a principal component analysis on a local datapool does not necessarily produce the same factor structure as the originators of the scale have proposed. The outcome of the Corkery et al (2011) study implies a similar conclusion where the PCA on their local, Academic Confidence Scale data collected from university students showed that 20 of the 24 dimensions of the Scale loaded onto just three factors with the remaining 4 dimensions being excluded because they loaded substantially on to two or more factors. The three factors in this study were labelled 'Study', 'Interact' and 'Attend' reflecting the groupings of dimensions accordingly. The Rotated Component Matrix was not published so scrutiny of which dimensions loaded onto which factors has not been possible, however the labels attributed to the Corkery factors imply similarities to Factors 1,2,4 in my study (Study Efficacy, Engagement, Attendance). [This para isn't very good - I need to rethink and rewrite this]
4.3 Dx Factor x ABC Factor Matrix
The principal component analysis applied to the data acquired through the Dyslexia Index metric suggests that it loads onto 5 factors and these have been designated:
- Reading, Writing, Spelling
- Thinking and Processing
- Organization and Time-management
- Verbalizing and Scoping
- Working Memory
and that the PCA applied to data collected on Sander & Sanders full, 24-item Academic Behavioural Confidence Scale has also loaded onto 5 factors, designated:
- Study efficacy
- Engagement
- Academic output
- Attendance
- Debating
The dimensions that constitute all of these factors are listed again in the table below as these will be referred to in the analysis which follows:
To explore the interrelationships between each of these two sets of 5 factors, a 5 x 5 cell matrix has been constructed, presented and discussed in more detail below, which sets out Hedges' 'g' effect size and Student's t-test p-values between the three research subgroups, DNI (TEST), DI-600 (CONTROL) and ND-400 (BASE) when these are re-established according to each of the Dyslexia Index factors in turn. This means that respondents' datasets have been re-sifted 5 successive times using each Dx Factor in turn as the sole sifing criteria. The outcome of the sifting process produces different research subgroups when the Dx boundary value of Dx = 592.5 is freshly applied. So for example, when research group ND is sorted with Dx Factor 1 as the sort specifier, the TEST subgroup and the BASE subgroup will each contain a different set of respondent datasets in comparison to those obtained when Dx Factor 2 is the sort specifier, and so forth. To arrive at the Dx factor values, the weighted mean average process applied to the dimensions has been retained with only a scaling factor being introduced to adjust the weighted mean averages to a value #/1000. The rationale for using the weighted mean average has been described earlier in the Research Design section.
Thus, ordering and re-ordering the datasets into the three subgroups according to Dx values for each Dx factor has generated a fresh opportunity to analyse the data from a deeper perspective. It is drawing on the more recent view that dyslexia, such that it can be defined, is most likely to be a multifactoral condition and that the relative balances of the factors can be significantly different from one dyslexic individual to another whilst both are still identified as dyslexic. This principle of theory has been described more fully in the Section: Theoretical Persectives, above but in summary, the arguments supporting the multifactoral approach have been developed most lately by Tamboer, Vorst and Jon (2017), building on the earlier ideas of Pennington (2006) and more lately of Le Jan et al (2011) and Callens et al (2014).
The objective in exploring the Dx-ABC matrix is to see if this can lead to a better understanding about the impacts of specific groups of dyslexia dimensions on not only academic confidence overall but also on the components of academic behavioural confidence where these too, have been established by the process of principal component analysis.
To understand more clearly the process of dataset ordering/re-ordering according to Dx Factor consider as a case study example, student respondent #96408084 in the datapool who is in research group ND because no reported dyslexia was declared but who presented an overall Dyslexia Index of Dx = 604.94. At the outset, this Dx value placed this respondent into the TEST research subgroup, DNI, which is students with an unreported dyslexia-like profile and as with the complete datapool, together with the initial declaration of dyslexia/no dyslexia, applying the Dx boundary fence has sorted all datasets into groups and subgroups accordingly which has enabled an overall idea to have been established about the impact of dyslexia on academic confidence, summarized in Key Outcomes 1 and 2 above.
However when this student's dataset is reviewed on a factor by factor basis, the Dx factor values are quite disparate ranging from Dx = 824.11 in Factor 1, Reading, Writing, Spelling, to Dx = 80 in Factor 4, Verbalizing and Scoping. So although this respondent is sifted into research subgroup DNI on the basis of overall Dx value, because at Dx = 604.94 this is above the boundary value of Dx > 592.5, when the Dx value for each factor is considered in turn this student will be sifted into research subgroup DNI only for Factors 1 and 2, as Dx values for the remaining factors are below the boundary value of Dx = 592.5. Indeed with a Dx Factor 4 value of Dx = 80, this particular student would actually feature in research subgroup ND-400 for Dx Factor 4 Verbalizing and Scoping, which is the research subgroup of students presenting very low levels of dyslexia-ness, and for Dx Factors 3 and 5, this student's data would not be sifted into any of the three, key research subgroups on which values of Academic Behavioural Confidence are being compared.
Dx overall Student respondent Dx Factor 1 Dx Factor 2 Dx Factor 3 Dx Factor 4 Dx Factor 5 Reading, Writing, Spelling Thinking & Processing Organization & Time Management Verbalizing & Scoping Working Memory 604.94 #96408048 824.11 746.99 512.26 80.00 489.51 = RG:DNI (TEST) = RG:DNI (TEST) =RG:DNI (TEST) =RG:NDx400 =RG:ND-400 (BASE) =RG:NDx400 The significant point is that the Dx values for Dx Factors 1 and 2 are high, suggesting that this particular student is presenting a strongly dyslexic profile in the two (factor) areas of Reading, Writing, Spelling, and Thinking & Processing – conventionally regarded throughout decades of dyslexia research with children as being key indicators of the syndrome. Although this quasi-dyslexia is only indicated through the self-report output of the Dyslexia Index Profiler, which, as has been established earlier is not, and is not claiming to be a dyslexia screener, it is nevertheless possible that this output may be indicating that this student does present a dyslexia that so far has been unidentified. The contention that this research project is aiming to justify however, is that such a student may be better left alone to pursue her studies in her own way rather than be formally screened and possibly identified as dyslexic because to do so may weaken her academic confidence. To support this, consider the outputs from her responses to the Academic Behavioural Confidence Scale and how these compare to the mean ABC Factor values for the research groups of non-dyslexic students (RG:ND) and dyslexic students (RG:DI):
ABC24 ABC24-1
Study EfficacyABC24-2
EngagementABC24-3
Academic OutputABC24-4
AttendanceABC24-5
DebatingRG:ND-400 mean values 72.31 67.75 66.92 79.85 83.05 72.19 RG:ND-400 standard deviations 12.35 16.57 16.05 13.57 19.44 21.58 RG:ND mean values 67.2 65.5 61.1 73.9 80.9 68.1 RG:ND standard deviations 13.9 17.8 18.1 16.4 19.2 21.3 no. SD's above + / below - RG:ND means +0.19 -0.02 +0.04 +1.39 +0.47 -1.93 This respondent #96048048 70.7 65.1 61.9 96.8 90 27 no. SD's above + / below - RG:DI means +0.79 +0.43 +0.76 +1.68 +0.47 -1.59 RG:DI mean values 58.4 54.9 47.7 62.8 80.4 64.4 RG:DI standard deviations 15.5 23.1 18.6 20.2 20.1 23.5 RG:DI-600 means 57.89 55.92 45.76 59.89 81.82 66.38 RG:DI-600 standard deviations 15.24 21.56 19.31 20.24 17.87 22.59 Aside from being a very interesting overview of this student's ABC values both overall and at a factorial level, by viewing in relation to the mean values of both the non-dyslexic (RG:ND) and the dyslexic (RG:DI) groups a picture emerges which shows this student's academic confidence is approximately at or above the mean values for non-dyslexic students, with values ranging from -0.02SD to +1.39SD except for ABC Factor 5, Debating, where we see a value of nearly 2 standard deviations below the mean value for the non-dyslexic group. When compared with mean values for the dyslexic group which as can be seen are all depressed relative to the non-dyslexic means although only very marginally for the ABC Factor 4, Attendance, we see an even starker contrast where this student's mean ABC values range from +0.43SD to +1.68SD above the dyslexic group's mean values with again, only the ABC Factor 5 mean value showing a contrary result.
In a real-world, university-learning context it can argued that gaining a perspective on this student's blend of academic learning management strengths and weakness and about their academic confidence across the spectrum learning and study behaviours and preferences related to academic study could be highly useful, not only for university learning development tutors for assessing where this individual might benefit from advice and development to mitigate the impact of apparent learning challenges whilst at the same time capitalize on areas of strong competency, but also to the student themselves as a means to enhance their metacognition and metalearning to enable them to become more at ease with their own study routines, to enable them to reflect on how some of these may be modified to mitigate a variety of affective responses to the challenges of study that they may come to realize are inhibiting factors in relation to their academic performance, In addition to the Dx Factor-based profile that has been generated and displayed earlier in this thesis report, a more detailed profile map which presents data for every Dyslexia Index dimension collectively in the form of a 'rose' chart may also be a powerful gauging instrument and as an exemplar, the rose chart has been generated for this case-study example student respondent #96408048 (below). Although not constructed and displayed here, it is of course possible to construct a similar rose chart profile diagram for this student's blend of actions, plans and behaviours related to their academic study as revealed by their self-report output on the Academic Behavioural Confidence Scale which would be equally valuable.
[Dimensions are grouped according to the Dx Factors which contain them rotating clockwise thus: Dx Factor 1, Reading, writing, spelling: Dimensions Dx20 -> Dx02; Dx Factor 2, Thinking and processing: Dimensions Dx15 -> Dx16; Dx Factor 3, Organization and Time-management: Dimensions Dx05 -> Dx07; Dx Factor 4, Verbalizing and scoping: Dimensions Dx 14, 04; Dx Factor 5, Working memory: Dimensions Dx13, 12].
Consider the summary table and rose chart (below) for another respondent whose overall Dyslexia Index value of Dx=306.04 placed this student in the BASE research subgroup of those whose Dyslexia Index indicated low levels of dyslexia-ness (Dx<400). As would be expected, levels of dyslexia-ness are generally low although some significant anomalies are immediately apparent, notably where this respondent has self-reported as an holistic thinker (Dx-14) and also reports significant challenges in organization and time-management which has emerged as not uncommon across the complete datapool and is discussed further below.
Dx overall Student respondent Dx Factor 1 Dx Factor 2 Dx Factor 3 Dx Factor 4 Dx Factor 5 Reading, Writing, Spelling Thinking & Processing Organization & Time Management Verbalizing & Scoping Working Memory 306.04 #65118727 288.88 259.95 504.69 539.22 293.90 = RG:ND-400 (BASE) = RG:ND-400 (BASE) =RG:ND-400 (BASE) =RG:NDx400 =RG:NDx400 =RG:ND-400 (BASE)
As a final comparison, the rose chart below presents the blend and balance of dyslexia dimensions presented by a respondent with identified dyslexia and with a significant level of dyslexia-ness of Dx=719.63 as determined through the Dyslexia Index Profiler which falls at the median position in the CONTROL research subgroup. It can be seen how generally different this profile is in comparison to the profile directly above for a respondent from the non-dyslexic BASE research subgroup although some similarities are present. More interesting and significant is the likeness of the chart of the respondent from the TEST subgroup of quasi-dyslexic students (top) to the dimension profile below of the dyslexic student.
Dx overall Student respondent Dx Factor 1 Dx Factor 2 Dx Factor 3 Dx Factor 4 Dx Factor 5 Reading, Writing, Spelling Thinking & Processing Organization & Time Management Verbalizing & Scoping Working Memory 719.63 #17465316 752.00 647.03 635.03 764.53 516.34 = RG:DI-600 (CONTROL) = RG:DI-600 (CONTROL) = RG:DI-600 (CONTROL) = RG:DI-600 (CONTROL) = RG:DI-600 (CONTROL) =RG:DIx600
It is immediately apparent that these three students present different blends of strengths and weakness in academic learning management and dyslexia-ness characteristics with not only contrasts, but also similarities being clearly visible and whilst some further developmental work needs to be conducted to validate and refine the Dyslexia Index Profiler (or however it may be more properly titled), the concept shows promise for becoming a useful mechanism to enhance the targetting of learning development or study skills initiatives in university contexts. It is hoped that there will be an opportunity to return to this at a later date.
In summary:
It must be re-emphasized that the datasets which comprise research subgroups ND-400, DNI and DI-600 after sifting the datapool according to Dyslexia Factor 1 values for example, will or may contain a different collection of datasets when the sifting criteria is according to Dx Factors 2, 3, 4 and 5. The table below summarizes how the sizes of the research subgroups change as a result of this process. These redistributions of the datapool enable a alternative insight to be taken into differences in academic confidence (at a factoral level) between students with reported dyslexia and those with unreported dyslexia-like profiles on a Dx factor-by-factor basis. At the outset this appears to be over-complicating the analysis process but it is justified because the results that emerge appear to be showing a range of significant differences across the research subgroups when these are examined with Dyslexia Index Factor as the determining criteria. As reported in the literature review earlier, examining dyslexia at a factorial level has been gaining traction in recent research and particularly a late study conducted with students at the University of Amsterdam (n=154) demonstrated nine distinguishable factors of dyslexia. These were classified as: Spelling, Reading, Rapid Naming, Attention, Short-Term Memory, Confusion, Phonology, Complexity, and Learning English (Tamboer et al, 2017). Note the researchers' comment that this final factor, Learning English, might only have become significant in their cohort of students because these individuals were highly academically competent in their own language (Dutch) and likely to have overcome many of their earlier linguistic difficulties in their native tongue, but not with foreign languages. It may be reasonable to discount this factor in student coherts with L1 English. This paper has been particularly singled out not only as an example of a study that has explored dyslexia at a factorial level, but also because the cohort of research participants used in the study closely resemble those in my project, particularly because they comprised known dyslexic students, those who were clearly presenting no indications of dyslexia as determined by any of the conventional criteria, but also, a significant subgroup of maybe-dyslexics emerged out of the analysis. The outcomes of the study have a bearing on the factorial analysis outcomes in my project due to the similarities of the factors and the process by which they were established. This is despite Tamboer et al's principle interest being determination of the predictive validity of their newly-developed screening test for dyslexia in the Dutch language. Their research suggested that this validity was strong, leading to the conclusion that the screening test that had been developed would be useful as a dyslexia identifier in higher education contexts. Of particular interest was that the self-report questions that had been included in their data collection instrument also returned high construct validity and significantly, an even higher predictive validity than the other tests that had been included in the screener (ibid, p167). A more reflective review of this and other relevant studies recently conducted in The Netherlands has been included as part of literature review in the Theoretical Perspectives section earlier. To date, no studies have been found which use a factorial analysis of a dyslexia evaluator in higher education settings as an independent variable correlator for exploring another construct, in the case of this project, academic confidence.
Reconstructed Research Subgroups
Thus, the outcomes of the process described directly above is shown in the table below which summarizes the relative sample sizes of the reconstructed research subgroups when these are sifted according to Dyslexia Index Factor using the established boundary value of Dx=592.5. Recall that this boundary value provided the criteria for sorting students from research group ND (n=98) into the TEST subgroup: RG:DNI and the CONTROL subgroup: RG:ND-400, and for sorting students from research group DI (n=68) into the CONTROL subgroup: RG:DI-600.
The table is important and is interpreted thus:
- For each Dx Factor, the top three rows of data list how the core research groups ND and DI are sifted into research subgroups giving the each new sample size as well as its percentage of the respective parent research group. So for example when research groups are sifted according to Dx Factor 1, the new research subgroup ND-400 is sample size n=40, which represents 41% of the parent research group ND (n=98).
- The lower section of the table shows sample mean Dx values for each of the subgroups. The main focus is on the mean Dx values for subgroups DNI and DI-600, with outputs from the t-test for significant differences between sample means (a 2-tail test at the 5% level of significance) being reported. The sample mean Dx values for research subgroup ND-400 is also provided for comparison between the absolute values.
In the complete datapool it has been established through the t-test that by setting the boundary Dx value at Dx=592.5, the mean (overall) Dx values were not significantly different between the TEST and the CONTROL subgroups and therefore it is reasonable that the sample mean Academic Behavioural Confidence can be properly compared betweeen these two subgroups because they are presenting (statistically) the same mean Dyslexia Index. Thus it has been important to apply the t-test comparator again when datasets have been sifted into reconstructed research subgroups on a Dyslexia Index factor-by-factor basis because the datasets comprising each research subgroup are reconstituted 5 different ways according to each of the 5 Dx factors and consequently, the mean Dx values have to be recalculated. This process is to ensure that the Dyslexia Index means remain not significantly different between the reconstructed research subgroups of interest (TEST and CONTROL) and that therefore it will be appropriate to apply the earlier rationale, that it is justifiable to consider ABC effect sizes for differences in mean ABC values on an ABC factor-by-factor basis. It can be seen that for every Dx Factor there remains no significant differences between the respective Dx sample means of the TEST and the CONTROL subgroups and hence this criteria for subsequently examining respective values of Academic Behavioural Confidence is reasonable. [Note: the designation 'Dx20(5)' is reminding us that the 20-scale-item Dyslexia Index Profiler with 5 factors is the data source.]
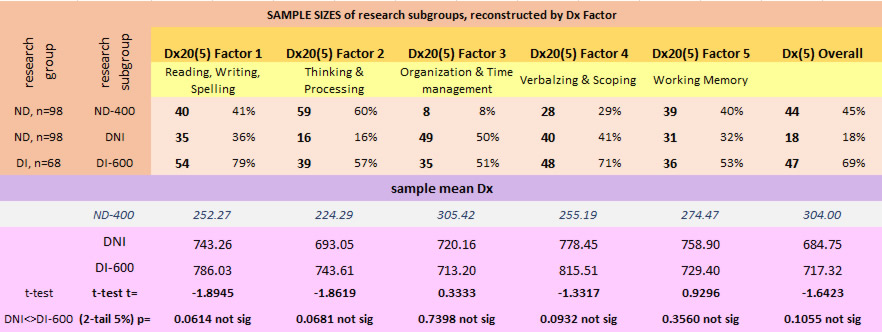
However some notable features emerge out of this summary table that are worthy of comment and reflection first:
- When the datapool is sifted according to Dx Factor 3, Organization & Time management, the proportion of students in research group ND (those with no declared dyslexia), whose Dyslexia Index value places them into the TEST research subgroup DNI, rises from 18% of their parent research group to a new proportion of 50%. This is telling us that 50% of students with no declared dyslexia are nevertheless presenting levels of dyslexia-ness that are comparable to declared dyslexic students for dimensions that are gauging their levels of organization and time-management in their academic study behaviours. Given that 51% of students in research group DI (those with declared dyslexia) are sifted into the CONTROL research subgroup by the same criteria this outcome is suggesting that as many students with dyslexia as those without consider themselves to have poor levels of organizational and time-management competencies in their studies. We know that this aspect of academic learning management commonly presents issues for students with dyslexia at university (Mortimore & Crozer, 2006, Kirby et al, 2008, Olofsson et al, 2012, MacCullagh et al, 2017) but it is of note that the non-dyslexic students in this project appear similarly challenged which may be suggesting that weaknesses in developing effective strategic competencies in organizational and time-management skills is widespread amongst student communities and not limited to those with specific learning difficulties.
- In sifting the datapool according to Dx Factor 1, Reading, writing, spelling, the Dyslexia Index Profiler appears to offer a concurrent identification of these conventionally accepted aspects of dyslexia to other dyslexia identifiers, this being indicated by 79% of participants in research group DI returning substantive levels of dyslexia-ness (Dx > 592.5) on dimensions that constitute this factor in the Dx Profiler. However by considering how this Dx Factor distributes students in research group ND, we notice that nearly twice as many would be categorized with levels of dyslexia-ness that would sift them into the TEST research subgroup were this the only criteria in comparison to the number sifted into this research subgroup according to the overall Dyslexia Index value. This appears to be suggesting two things: firstly that issues with reading, writing and spelling also occur quite commonly amongst non-dyslexic students, and secondly, other Dx Factors aside from Factor 1 appear to be making a greater contribution to the overall Dyslexia Index value criteria that sifts apparently non-dyslexic students into the TEST research subgroup of students presenting high levels of dyslexia-ness. This outcome may be indicating that the more conventionally-applied dyslexia screening tools are weighted towards identifying dyslexia through apparent weaknesses in literacy skills because those who do not present such weaknesses but who are indicated as having significant other challenges in their academic learning management competencies are not identified as dyslexic. It is also possible that this bias towards identifying deficits in literacy skills is a legacy of child-focused dyslexia identifying processes where issues in acquiring reading skills in early years learning are well documented as possible indicators of dyslexia.
- The effect of sifting the datapool according to Dx Factor 2, Thinking and processing, is also worthy of comment where we see that more than any of the others, this factor sorts the highest proportion of students in research group ND into the BASE research subgroup, which is students showing very low levels of dyslexia-ness (Dx < 400) and only 16% of the research group ND being sifted into the TEST research subgroup (Dx > 592.5) on the basis of this Dx Factor alone.
Outcome of the data reorganization process
Thus this process of exploring how principal component analysis impacts on the datapool for both variables, Dyslexia Index and Academic Behavioural Confidence, has led to the construction of the Dx Factor x ABC Factor Matrix (below).
The matrix is complex and difficult to understand but is attempting to find a way to explore differences in academic confidence between both dyslexic and non-dyslexic students and more so, between dyslexic and quasi-dyslexic students at a factorial level but by doing so it is possible that this is an over-complicated analysis although an attempt will be made to interpret the output. The matrix presents effect size differences and t-test outputs between mean Academic Behavioral Confidence values for the Test research subgroup, DNI, the Control research subgroup, DI-600, and the Base research subgroup, ND-400 when these research subgroups are reconstructed on the Dyslexia Index factor-by-factor basis. Two sets of comparators are considered to be pertinent: firstly between the group of students considered to be very unlikely to be dyslexic by presenting low levels of dyslexia-ness and those others considered to be highly dyslexic (RG:ND-400 and RG:DI-600 respectively) by presenting levels of dyslexia-ness Dx > 592.5; and secondly between the Control research subgroup (RG:DI-600) and the Test subgroup (DNI) and these data are presented in row-pairs for each Dyslexia Index Factor. In addition to the effect size differences being shown, the absolute ABC values are provided to contextualize the effect size values and the overall key findings of the analysis which relate back to the research hypotheses are indicated in the bottom-right of the matrix (the red box). To aid clarity, p-values for differences between factor mean ABC values for research subgroups ND-400 and DI-600 have been omitted with the exception of the overall result (bottom-right). However, where these are apposite, these data are provided in the discussion which follows below.
For example: consider the row of data for Dyslexia Index Factor 3: Organization and Time Management. When research subgroup DNI (from research group ND) and research subgroup DI-600 (from research group DI) are reconstructed using Dx Factor 3 as the sifting criteria (n=49, n=35 respectively, from the table of Sample Sizes above), it can be seen that the mean average for ABC Factor 1: Study Efficacy (for example) for the respondents in these reconstructed subgroups shows an effect size of 0.42 supported by a significant difference between the ABC Factor 1 sample means (p=0.0299). The represented the statistical analysis of the differences between the mean ABC values of ABC=65.3 and ABC=57.0 for research subgroups DNI and DI-600 respectively. In other words, students with declared dyslexia present Academic Behavioural Confidence that is significantly lower, statistically, than students in the datapool with no declared dyslexia but who present dyslexia-like profiles, when the data is arranged according to the Dx Factor, Organization and Time Management.
[table source: Excel sheet: CompleteDataset DxCompPCA BD425:BS451]Hedges 'g' has been used because this calculation uses a weighted mean process for pooling the standard deviations of each dataset being considered which is important when the datasets are of different sizes; Student's t-test for independent sample means is used in the one-tail format because this is consistent with the research null and alternate hypotheses stated above although aside from the overall analysis outcome (red-boxed) t-test outcomes are only provided for the differences in mean values between the CONTROL and the TEST research subgroups, not least to make the data table easier to comprehend. Effect size values between the BASE and the TEST subgroups are considered a sufficient indicator of differences.
Effect size between Academic Behavioural Confidence:
The matrix of effect sizes above is the most substantial data analysis outcome of the research because as well as highlighting the overall effect size between the Academic Behavioral Confidence values that address the main research hypotheses, it has also identified significant effect sizes in ABC factors that may not have otherwise been revealed.
The central analysis outcome evidences a very highly significant difference between the mean values of Academic Behavioural Confidence between students with identified and declared dyslexia (RG: DI) and students who declared no known, dyslexic learning challenges (RG:ND) leading to Key Outcome 1:
Key Outcome 1:
KEY OUTCOME 1:
On the basis of the analysis of this datapool, students with no indications of dyslexia are shown to have, on average, a substantially higher level of Academic Behavioural Confidence than their dyslexia-identified peers.
[RG:ND-400, ABC=72.3; RG:DI-600, ABC=57.9; Effect size: g=1.04; T-test: t=5.037 , p<0.0001]
The second, important overall key finding, which is of the essence of this project, is that the analysis identifies a medium, Academic Behavioural Confidence effect size of 0.48 between the TEST research subgroup: DNI and the CONTROL research subgroup:DI-600 (shown in the red box grid-sector extreme bottom-right of the matrix). This is the effect size difference between the mean ABC values of research subgroups that are constructed on the basis of the overall Dx values of respondents. Taken together with the independent sample means t-test this returns a p-value of p=0.043 (t=1.743, one-tail test), these outcomes are indicating a significant difference between the ABC sample means of the TEST and the CONTROL subgroups which address the second of the enquiry hypotheses and enables a further, more significant key outcome to be stated:
Key Outcome 2:
KEY OUTCOME 2:
On the basis of the analysis of this datapool, quasi-dyslexic students, that is, students with unreported, dyslexia-like profiles, are shown to have, on average, a significantly higher level of Academic Behavioural Confidence than their dyslexia-identified peers.
[RG:DNI (CONTROL), ABC=64.9; RG:DI-600 (TEST), ABC=57.9; Effect size: g=0.48; T-test: t=1.743 , p=0.043]
These two key outcomes directly address the project's core, research hypotheses: firstly that students with dyslexia present a significantly lower academic confidence, as measured through the Academic Behavioural Confidence Scale, and therefore probably a lower level of academic self-efficacy, than their non-dyslexic peers. Key Outcome 1 evidences this conclusion. Secondly, Key Outcome 2 is indicating that students with quasi-dyslexia present a measurably and significantly higher level of academic confidence than their equivalently dyslexic peers, as determined through the ABC Scale, and also most probably a higher level of academic self-efficacy. These are highly significant results and they are suggesting that students at university with dyslexia but who may be unaware that they may be dyslexic are best left not knowing this because to otherwise suggest that they consider taking a dyslexia screening test, possibly leading to a full dyslexia assessment - such as this may be - and which may subsequently indicate that they have a dyslexic learning difference might adversely affect their academic confidence, their academic self-efficacy and perhaps their academic achievement.
Academic Behavioral Confidence differences on a factor-by-factor basis
The bottom part of the table (above) provides effect size differences and t-test outcomes in ABC Factors for the three research subgroups ND-400 (BASE), DNI (TEST) and DI-600 (CONTROL) with datasets sifted into each of the subgroups according to the overall Dyslexia Index value. From this row of data we can observe the contributions made to the overall ABC24 effect size differences and t-test outcomes by each of the five ABC Factors and from this an interesting picture emerges: firstly, it can be seen that very little, if any contribution is made by the two ABC Factors 4, Attendance, and 5, Debating, with small or negligible effect sizes between the Test and the Control subgroups and between the Control and the Base subgroups. This seems to be indicating that dyslexia, quasi-dyslexia or non-dyslexia makes little difference to students' academic confidence in relation to their attendance regimes, and the ways in which they interact academically with their peers and with their teachers in one-one settings. This is not to say that there are no differences in attendance regimes and peer and lecturer interactions between dyslexic, quais-dyslexic or non-dyslexic students, it is indicating that academic confidence is not a factor which influences this. Whereas the greatest contribution to the overall effect size comes from ABC Factor 2, Engagement (g=0.61) where the t-test also reveals a significant difference at the 5% level between the mean ABC Factor values of the Test and the Control subgroups (ABC24-2: 57.4, 45.8 respectively, t=2.197 , p=0.0159), and from ABC Factor 3, Academic Output (g=0.41) where although the t-test does not return a significant result at the 5% level for the difference between the Test and Control subgroup sample means (ABC24-3: 68.2, 59.9 respectively, t=1.475, p=0.0726) a 'medium' effect size is obtained.
ABC24-2, Engagement, is concerned with the processes and action-activities of study and include for example, following themes and debates and asking questions in lectures, and 'presenting' to student peers and so this medium to large effect size between ABC24-2 values for the Test and the Control subgroups is indicating a substantial difference in academic confidence between dyslexic and quasi-dyslexic students. If we are to take 'academic confidence' in this context as a reflection of self-confidence then we can locate this difference as a marker about how self-appraisal of efficacy can be strongly influenced by social comparisons (Bandura, 1997b). This may be particularly significant for students with dyslexia who feel socially stigmatized as a consequence of internalizing their learning difference as a disability that is perceived negatively in peer comparison situations (Murphy, 2009, Dykes, 2008), and hence are less likely to participate and engage in study action-activities which may expose their dyslexia. One respondent typifies these feelings of disenfranchisement through the comments that he added in his questionnaire answers:
- "I don't like feeling different because people start treating you differently if they know you have dyslexia and normally they don't want to work with you because of this ... I don't speak in class because I am not very confident at answering questions in case I get them wrong and people laugh" (Respondent #85897154; RG:DI; ABC = 47.3; Dx = 797.89)
Cameron (2016) in a case study of dyslexic students in higher education reported similar findings of reticence in voicing opinions in the company of peers and clear feelings of social disenfranchisement were evidenced in study exploring feelings and attitudes of a similar group of students to university:
- "I find the world is not arranged in a way that uses my abilities. Rather it is arranged in a way that emphasises my problems" (Thompson et al, 2015, p1338).
Another respondent from the dyslexic group demonstrated the lasting impact of feelings of difference stemming from experiences in earlier schooling:
- "I do have to battle with elements of doubt ... particularly influenced by bullying at primary and secondary school to do with 'stupidity' and 'slowness' and my seemingly unrelated comments to topics at the time" (Respondent #87564798; RG:DI; ABC = 49.2; Dx = 751.23)
although some students with dyslexia are clearly endowed with inner strength that can enable them to mitigate earlier disparagement and build sufficient levels of confidence to tackle university study:
- "When I was at school I was told that I had dyslexia; when I told them I wanted to be a nurse they laughed at me and said I would not achieve this and I was best off getting a job in a supermarket. Here I am now, doing nursing!" (Respondent #48997796; RG:DI; ABC24 = 84.6; Dx = 835.65)
The large effect size of g=1.19 between the Base and the Control subgroups for this ABC Factor is the second-largest of all the effect size differences between these subgroups and with the mean ABC Factor 3 values of 66.9 (Base) and 45.8 (Control) is highly indicative of the differences between the academic confidence of non-dyslexic students and strongly dyslexic students amongst this family of action-activities in study at university.
ABC24-3, Academic Output, encompasses academic performance including dimensions such as writing in an appropriate style, attaining good grades and producing good quality coursework and with a medium effect size between the Test and the Control subgroups of g=0.41 this also indicates a strongly measurable difference between the academic confidence of quasi-dyslexic and dyslexic student in this ABC Factor. Although at face value this also appears to be indicating that students with identified dyslexia present lower levels of academic confidence about performing at a good standard academically in comparison to their quasi-dyslexic peers, without controlling for other variables such as academic aptitude or legacies from prior academic history and attainment, this outcome should be viewed cautiously. However a highly significant difference between the ABC Factor 3 values of the Test subgroup of strongly dyslexic students and the Base group of non-dyslexic students is indicated by a large effect size (g=1.15) with ABC24-3 values of 59.9 (Test) and 79.9 (Base) and with the sample sizes of these subgroups of n=47 (Test) and n=44 (Base) being respectable, this is a strong indication that the academic confidence of students with dyslexia towards their academic performance outcomes is strongly depressed in comparison to their non-dyselxic peers. This may be related to attitude to tackling difficult work where high standards are expected. One respondent from the non-dyslexic group wrote:
- "As soon as I get a piece of coursework I try to get it doen to a high standard ... Overall I don't think I pick things up quick[ly]. I'm more of a hard worker than a natural learner. Some of my friends can interpret data straight away whereas I have to take my time to understand it" (Respondent #60017207; RG:ND; ABC24 = 90.2; Dx = 466.90)
which also indicates that this student has not only developed a good work-study ethic but also has an understanding of his own metalearning processes.
Exploring Academic Behavioural Confidence on a Dyslexia Index factor-by-factor basis
By looking in more detail at the matrix of effect size and p-value results for the component analysis for both metrics (Dx and ABC) it is possible to explore where the contributing differences between Dx and ABC for each of the subgroups lies and speculate about what this may mean:
Sifting the datapool by Dyslexia Index Factor 1: Reading, writing, spelling
When the data is sifted according to Dx Factor 1 only, there is a negligible ABC (overall) effect size between the Test and the Control subgroups (-0.07) suggesting that were dyslexia attributable to only the literacy family of dimensions, there is no difference in academic confidence between students who know about their dyslexia and students who may have an unidentified dyslexia, or may be quasi-dyslexic which here may be indicating students who are 'garden variety' poor readers and spellers (Stanovich, 1996, p157) - that is, are resembling dyslexia. However the effect size between dyslexic students in the Control subgroup and non-dyslexic students in the Base subgroup is large (g=1.14) with the outcome from the t-test indicating a very highly significant difference between the mean ABC values (t=5.286, p < 0.00001, ABC24: 58.4(Control), 73.8(Base)) which is indicating that competency in literacy skills is likely to have a very significant impact on academic confidence. This appears to be adding to the argument that while competency in literacy remains a significant conduit for academic ability to be gauged at university, students who know that they struggle in this area will be further impacted by reduced academic confidence - altogether not an unsurprsing deduction but nevertheless highlights that were curriculum delivery and especially assessment processes broadened to reduce the reliance on literacy skills, courses would become more accessible and inclusive, and those who have better processes for expressing their ideas and communicating their knowledge would not be disadvantaged.
For ABC Factor 4, Attendance, we see a medium effect size of -0.40 between the Test and the Control subgroups and this is the only outcome where the difference between the mean ABC Factor 4 values is significant. ABC Factor 4 is an evaluation of the study behaviours relating to attending lectures and being on time for them, and attending tutorials, so this result seems to be indicating that the quasi-dyslexic students in this datapool, which in this sifting process comprise 39% (n=35) of the students in the non-dyslexic research group (n=98) representing an increase in the Test subgroup sample size by nearly 100%, may be the least diligent in attending their classes. This could be an indication that the quasi-dyslexic students in this datapool are indeed unidentified dyslexics and these students tend to avoid lectures, classes and tutorials more than their peers because they find them particularly challenging, possibly for any number of reasons but significantly, they may be unaware that the literacy challenges that they experience may be related to an unidentified dyslexia. Significant evidence has been cited in the literature review section of this thesis relating to levels of unidentified dyslexia in university students or where dyslexia is identified at some point during these students' courses. For identified dyslexics, it is possible that these students support themselves with a variety of strategies and study-aid devices and techniques which enable them to engage more effectively with formal teaching situations and hence, they are not deterred from attending them. It is significant to note that for the three ABC Factors, Study Efficacy - which gauges expediency in working through academic tasks by measuring dimensions such as 'studying effectively independently' or 'remain adequately motivated throughout university' for example; Engagement - which provides a measure of student-teacher and student-student interaction, exam performance and willingness to ask for help; and Academic Output - broadly gauging confidence in assessment performance, the effect sizes between non-dyslexic students and their dyslexic peers are substantial (g=0.85, 1.23, 1.19 respectively) which is indicating strongly depressed academic confidence in students with dyslexia in these factors of Academic Behavioural Confidence.
Dyslexia Index Factor 2: Thinking and processing
Sifting the datapool according to Dx Factor 2 reduces the sample size of the Test subgroup to n=16 (from n=18, representing an 11% reduction), hence establishing just 16.3% of the non-dyslexic students to be quasi-dyslexic if this criteria alone is the determining attribute. However a similar reduction is also observed in the sample size of the Control subgroup which reduces to n=39 (from n=47) which may be suggesting that the family of dimensions that constitute Dx Factor 2 are less significant in determining dyslexia-ness overall because fewer students in the complete datapool are then presenting levels of dyslexia-ness that is above the fence of Dx > 592.5. In the complete datapool, these students would then represent 33.1% of the total number of research participants (n=55/166) whereas in applying the Dyslexia Index fence Dx > 592.5 to each research group - that is, to the group of declared dyslexic students (RG:DI) and to the group of declared non-dyslexic students (RG:ND) - and then combining these, this would represent a total of n=65/166, being 39.2% of the total datapool. Thus if the attribute for determining whether a student is dyslexic or not according to the Dyslexia Index Profiler were solely based on the family of dyslexia dimensions related to thinking and processing, fewer students would be considered as dyslexic. This might be suggesting that were we to think of dyslexia primarily as a thinking and processing difference, it would be less prevalent, However it is noticeable that there is a significant difference at the 5% level between the mean ABC values of the Test subgroup and the Control subgroup in ABC Factor 3, Academic Output, (t=2.175, p=0.0172) with medium-to-large effect size of g=0.66, and for ABC Factor 2, Engagement, a close-to-significant difference in mean ABC values with a medium effect size of g=0.43 which is suggesting that even were Thinking and Processing the determining factor of dyslexia, a student who is identified is likely to present substantially lower levels of academic confidence than were they not to be identified, in aspects of their studies at university that are part of the academic processes of engaging with academic materials both independently, with their teachers and with their peers, and in assessment processes. A theme which emerged out of respondents' comments suggests that some felt inadequately prepared for independent learning or finding out more about their own learning processes, characteristics that are recognized as desirable in university study, with some observing that tutorial sessions for study or academic skills missed the target. Two respondents from the dyslexic group said respectively:
- "... universities provide support with tutorials geared at helping the individual with learning but somehow they seem to expect that a person understands what they find difficult ... because they have been living with it their whole lives and can't see objectively what is 'wrong' "(Respondent #87564798; RG:DI; ABC = 49.2; Dx = 751.23)
- "I find independent learning quite difficult and would prefer more in depth help from tutors to give a clear[er] idea of what is accept[able]" (Repondent #17465316; RG:DI; ABC = 56.5; Dx = 719.63)
Another respondent, in this case from the non-dyslexic group commented:
- "Ways that studying at university can be improved is by far, to teach students how to learn. We're always taught the content for a specific subject but has anyone ever taught a student on how to learn?"(Respondent #52289216; RG:ND; ABC = 56.9; Dx = 570.73)
These comments may reflect a lack of progress in how some institutions deal with student pre-conceptions about what it is to study at university and be an independent learner in response particularly to the surge in students now attending universities as an outcome of widening participation initiatives that aim to especially enrol learners from traditionally poorly represented backgrounds. For many of these students the transition to university initiates a conflict in values bringing a challenge to an earlier-established identity and poses a threat to familiar ways of knowing and doing (Krause, 2006 in Brownlee et al, 2009). Information processing and thinking about it are rightly considered to be critical components of learning and if there are now indications that many students attending university feel unprepared for these cognitive demands this may also be a reflection on the style and structure of their prior learning experiences which, in the UK at least, may have become increasingly reversive towards old learning structures grounded in rote in order to meet demands for greater accountability and in response to institutional academic competitiveness with an equally increased dependency on supplementary subject tutoring and exam coaching.
Thus evidence from the data collected in this project indicates a substantial disparity in academic confidence between dyslexic and non-dyslexic learners in the factors related to engagement and to academic output not only overall, as described above, but also when the datapool is sifted according to the Dyslexia Factor 2 criteria, Thinking and Processing. Very large effect sizes are recorded between the Control and the Base subgroups in these two ABC factors (g=1.09, g=1.12 respectively) with the differences in absolute mean values being considerable (ABC24-2: 46.6(Control), 65.3(Base); ABC24-3: 59.0(Control), 78.0(Base)). Also indicated is a medium effect size between dyslexic and quasi-dyslexic subgroups in overall Academic Behavioural Confidence (g=0.45; ABC24: 57.3(Control); 70.6(Test)) with a close-to-significant difference between the means (p=0.064) at the 5% level, which indicates that when the datapool is sifted according to Dyslexia Index Factor 2, Thinking and Processing, the academic confidence of dyslexic students in the Control subgroup is substantially depressed in comparison to quasi-dyslexic students in the Test subgroup. Further, the academic confidence of dyslexic students in the Control subgroup is very significantly depressed in comparison to non-dyslexic students in the Base subgroup (t=3.424, p=0.00047: highly significant at the 1% level; g=0.95 'large'; ABC24: 57.3(Control); 70.6(Base)).
Dyslexia Index Factor 3: Organization and time management
When the datapool is organized according to Dyslexia Index Factor 3: Organization and Time Management, notable effect size differences arise between the Test and the Control research subgroups in all five factors of Academic Behavioural Confidence. There are several features of this data re-organization that warrent comment: firstly, it produces a Test subgroup that is the most sizeable (n=49/98 = 50%) in comparison to the four other Dx Factor sifing processes, together with the smallest Base research subgroup (n=8/98 = 8.2%). In other words, using Dx Factor 3 as the marker for dyslexia-ness, 50% of the non-dyslexic research group would be classified as quasi-dyslexic. Secondly, effect size ‘g’ values between the Test subgroup and the Control subgroup range from g = 0.38 in ABC factor 5: Debating with the t-test indicating an albeit only just significant difference between the sample means (p= 0.046); to an effect size of g = 0.89 in ABC factor 2: Engagement. The t-test returned a very highly significant p-value of p=0.0001 (rounded to 4 dp, the actual p-value is p = 0.0000569). Given that effect size differences are one-tail, that is, are set so that a positive effect size indicates that ABC is higher for the Test subgroup than the Control subgroup, these results are indicating that students with reported dyslexia exhibit significantly lower levels of academic confidence when sifted according to the Organization & Time Management factor of Dyslexia Index. Recall that Dx Factor 3 comprises the dyslexia dimensions: 'I think I am a highyly organized learner', 'I find it very challenging to manage my time effectively', and 'I generally remember appointments and arrive on time'. Given that in total, 50.6% (n=84/166) of the complete datapool are presenting significant levels of dyslexia-ness when gauged through this Dx Factor alone this implies firstly that issues with organizational skills and time management are by no means endemic amongst the dyslexic student community at university alone, more so this outcome is suggesting that developing into an organized and time-efficient learner may be challenging for significant proportion of all students. But of particular note is the outcome which is showing an effect size of g=0.78 for ABC24 overall between the Test and the Control subgroups when these are determined by Dx Factor 3. In addition, the t-test outcome of p=0.0003 (t=3.528) indicates a highly significant difference at the 1% level between the mean ABC24 values (Test: 70.9; Control: 59.7) showing that quasi-dyslexic students are presenting a significantly higher level of academic confidence than their dyslexia-identified peers when viewed through the lens of organization and time management. Firstly this is suggesting that given we apply the useful definition of academic confidence from Sander & Sanders' earlier, (2003) study stated as '... the mediating variable that acts between individuals' inherent abilities, their learning styles and opportunities afforded by the academic environment of higher education', being identified as dyslexic significantly depresses academic confidence, and might also be indicative of the ineffectiveness of dyslexia-supporting learning development strategies designed to assist with organization and time-management accorded to students with dyslexia at university, assuming that these have been recommended and made available to identified dyslexic students by their higher education institution. Not knowing that you may be dyslexic appears to be better for you when it comes down to the study-skill attribute of organization and time management, however comments returned in the questionnaire do appear to confirm that issues with organization and time management are common across the student community: One respondent from the dyslexic student group located their dyslexia in the context of organizational challenges thus:
- "My dyslexia affects my organization abilities mostly. I'm strong academically ... despite quite strong learning difficulties because I have a good memory. [But] I am chronically late, disorganized and often have large dips in academic confidence" (Respondent #99141284; RG:DI; ABC24 = 33.8; Dx = 496.66)
Another respondent, this time from the non-dyslexic group provided a similar reflection, who with an overall Dx=346.15 is located in the Base research subgroup but presented a Dx Factor 3 value of Dx=576.29:
- "I have issues with procrastinating, time management and making an effective plan of knowing where to start ... I leave starting my work to the last minute and ... I leave little time for editing and improvements" (Respondent #21294241; RG:ND; ABC24 = 80.5; Dx = 346.15)
Another respondent echoed poor levels of institutional support that has been suggested by this analysis:
- "I think there could be more support for students with learning difficulties. As of yet, the dyslexic team haven't been very helpful or supportive" (Respondent #61502858; RG:DI; ABC24 = 61.9; Dx = 633.07)
although without learning more about this students circumstances and knowing something of the study support regimes offered by the Dyslexia Support Team if would be inappropriate to read too much into this student's comments.
However a different picture appears to emerge when looking at the differences between the dyslexic students in the Control subgroup and the non-dyslexic students in the Base subgroup when these are determined according to Dyslexic Index Factor 3. In all ABC24 factors except ABC24-4, Attendance, the effect size between these subgroups is small or negligible, contributing to an effect size difference in overall ABC24 of virtually zero (g=-0.09, ABC24: 59.7(Control), 58.4(Base). For ABC24 Factor 4, Attendance, a large negative effect size between these two sets of students (g=-0.72) although this was not supported by a t-test outcome which indicated only a close-to-significant result at the 5% level (t=1.532, p=0.0647). This outcome seems to be suggesting at face value that disorganized and poorly time-managed non-dyslexic students may also be less diligent in attending their teaching classes and tutorials in comparison to their dyslexic peers but with such a small sample size of non-dyslexic students in the Base subgroup (n=8) these outcomes can not be considered as properly indicative of any significant differences.
Dyslexia Index Factor 4: Verbalizing and scoping
The picture which emerges when Dx Factor 4 is applied as the sifting criteria for establishing the three research subgroups is also interesting. Firstly, it can be seen that there is a medium effect size (g=0.61) between the Control and the Test subgroups and although the absolute difference in mean ABC24 values does not appear to be particularly large (ABC24: 57.1(Control), 66.0(Test)) the t-test outcome indicated that this is a highly significant difference (t=2.861, p=0.0026). The principle contributor to this effect size is again arising from ABC24 Factor 2, Engagement as has been reported above in the discussion about outputs when the datapool is sifted according to Dx Factors 2, Thinking and Processing, and 3, Organization and Time-management, but also significant contributors are from the ABC Factors 1, Study Efficacy (g=0.38) and 3, Academic Output (g=0.44). For ABC24-2, Engagement, the effect size between the Control and the Test subgroups is large (g=0.81) with a substantial difference in absolute ABC24-2 mean values (46.1(Control), 60.0(Test)) supported by a t-test outcome indicating a highly significant difference (t=3.765, p=0.0002); For ABC24-1, Study Efficacy, a low-medium effect size (g=0.38) reflects the modest differences between absolute ABC24-1 mean values (52.8(Control), 61.1(Test) although the t-test outcome indicated a significant difference between these means at the 5% level (t=1.761, p=0.0409) and for ABC24-3, Academic Output, the respective absolute ABC24-3 mean values, effect size and t-test outcomes are similar (61.3(Control), 70.1(Test); g=0.44; t=2.065, p=0.0209). For the remaining ABC24 Factors 4 and 5, negligible effect sizes are observed.
These outcomes suggest that when students are categorized into the research subgroups according to Dx Factor 4, which incidentally generates Control and Test subgroup sample sizes that are similar (n=40 (Control), n=48 (Test)) significantly increasing the number of students identified as quasi-dyslexic using this criteria by more than double in comparison to the Test subgroup sample size using the overall Dyslexia Index values, there are marked differences in academic confidence between the Control and the Test subgroups in three of the five factors of Academic Behavioural Confidence. ABC dimensions in these impacting factors are relating to the ways in which students are efficacious, aware of and able to meet their assessment targets, but particularly in relation to their levels of engagement where there exists a highly significant difference in academic confidence in this factor. Although it must be stated that with only two dimensions in the sifting criteria, Dyslexia Index Factor 4, these being indicators of the means by which students appraise theories, ideas or tasks in their study courses and also the ways in which they express a preference to communicate what they know and how they might interpret this knowledge to others verbally rather than in writing, given that these two (dyslexia) dimensions might be considered as markers of atypical and more holistic thinking that is reflected in likely challenges in translating this into ordered, structured and linear writing processes, it is significant that the quasi-dyslexic students are presenting higher levels of academic confidence than their dyslexic peers. Again, this suggests that students who know about their dyslexia and perhaps are receiving study support in one form or another nevertheless remain challenged by academic processes that are core components of their study courses despite any learning support that they may be receiving. It is possible that it is the very help that they are receiving that may be a factor in reduced academic confidence, well-meaning as it will no doubt be (It should be pointed out that no direct evidence about dyslexic students' access to or receipt of support was queried in the research questionnaire and so suggesting that students may have received this is supposition only). Evidence for this emerges from some of the comments students provided:
In the earlier, Masters' dissertation pilot study students complained:
- "Extra support is not given in the right way. How doe extra time in exams help? It doesn't reflect what would happen in the real world. Changing the assessment techniques would be better" (Respondent QNR #7; Dykes, 2008, p82)
- "I did not use dyslexia support at all last year. I would prefer to ask for help when needed and I find the extra time in having to organize dyslexia support well in advance is not helpful" (Respondent QNR #28, ibid, p86)
- "I am unable to use support study sessions as I am already finding it hard to keep up with coursework and don't have time" (Respondent QNR #34, ibid, p89)
- "Going for help with studies takes up more of my time when I'm already struggling with too much work and not enough time; and it rarely helps as I can't explain why I'm struggling - otherwise I would have just done it on my own in the first place" (Respondent QNR #20, ibid, p99)
where it can be seen that systemic failings related to how support services are delivered are an impacting factor on some students' uptake of them. In this current study, conducted nearly a decade later and with students at a different institution, not dissimilar comments were provided:
- "[Support] should not just be for one type or group of people such as those with particular learning difficulties. [I] think that puts many people off as soon as they see the term 'learning difficulties' " (Respondent #71712644; RG:DI; ABC24 = 86.6; Dx = 592.48)
- "Lecturers need to be more supportive instead of referring me to learning support" (Respondent #67632469; RG:DI; ABC = 41.7, Dx = 682.21)
But evidence was also provided which did identify atypical preferences for thinking about and accessing academic work and how to communicate knowledge:
- "I am a visual person and for me it's easier to remember something if I am shown an image of that thing" (Respondent #90023507; RG:DI; ABC24 = 38.3; Dx = 748.93)
- "I usually use very visual ways to learn, for example drawing funny pictures to remember medication names ... and more interactive lectures would benefit me" (Respondent #74355805; RG:DI; ABC = 30.6, Dx = 699.15)
- "I found audio recording lectures was quite helpful; also when lectures were interactive or when images or films were included I got a better understanding of the subject" (Respondent #16517091; RG;DI; ABC = 59.7; Dx = 339.92)
- "I thoroughly enjoy seminars and lab classes and feel that I benefit much more academically in this setting [in comparison to] some days I have three consecutive hours of lectures ... after a while my attention wavers and I stuggle to focus" (Respondent #39243302; RG:ND; ABC = 56.5; Dx = 345.22)
- "I can sometimes have all-or-nothing thinking which makes it difficult to be critical and explain in detail - Sometimes it feels as if my mind spirals when I think about one topic for too long and I lose track of my original idea/thought" (Respondent #69417357; RG:ND; ABC = 56.6; Dx = 334.95)
which adds to this project's argument in support of a thorough revision of processes of curriculum delivery and assessment mechanisms so that these might be more in line with the ethos of Universal Design for Learning, cited earlier in the literature review. Evidence here suggests that the academic confidence of students with dyslexia is likely to be less negatively impacted were UDL more widespread in university learning but evidence is also provided that non-dyslexic students also evidence atypical thinking and information processing preferences or difficulties.
Dyslexia Index Factor 5: Working memory
Individuals with dyslexia are cited in literature as often experiencing differences in immediate memory function, commonly evidenced by scores in Digit Span and Letter-Number Sequencing sub-tests of wider assessments, for example as part of the WAIS-IV (Weschsler Adult Intelligence Scale) (Egeland, 2015) or phonological loop processing tests which deal with acoustic information, that is, speech sounds, and also written words, how these are converted into speech sounds in the mind, and how effectively these are retained in the short-term, or working memory. Information is temporarily stored and manipulated in the working memory and the phonological loop comprises the 'inner ear', which is linked to speech perception and information in speech-based form, that is, words, and the 'inner voice', related to speech production and is used to rehearse and store verbal information through the articulatory control process where written words are converted into speech sounds. These fundamental concepts were proposed in a seminal paper by Baddeley and Hitch (1974) who, through their Working Memory Model, argued that the initial stages of the memory system are complex, and in addition to the phonological loop components of the 'inner ear' and the 'inner voice', visual and spatial information is dealt with by the 'inner eye', termed as the visuospatial sketchpad and the complete process is overseen by a central executive. The earlier model was later updated to include an additional component, the episodic buffer, which integrates with the central executive and determines how much prior knowledge is drawn from the long term memory to aid working memory processes. (Baddeley, 2000). In individuals with dyslexia it has been widely demonstrated that reduced phonological awareness is strongly associated with reduced digit span performance (Melgy-Lervag et al, 2012, Gooch et al, 2011) which hence explains the interest and apparent relevance in identifying deficits in these capabilities in comparison with non-dyslexic norms amongst individuals who present for dyslexia screening.
There is not the scope in this project for a wider discussion about the relationship between working memory and dyslexia as this would be more than enough for a project in its own right. However, gaining some small measure of working memory differences amongst this project's participant datapool was considered useful. Hence just two dimensions were included in the Dyslexia Index Profiler which attempted to acquire at least a superficial overview of working memory capabilities. However by sifting the datapool according to Dx Factor 5, Working Memory, some useful differences have emerged. Firstly, this sifting process has the effect of nearly doubling the number of respondents classified as quasi-dyslexic in the Test subgroup (DNI) from a sample size of n=18 to n=31 whilst simultaneously reducing the sample size of the Control subgroup (DI-600) of identified and strongly dyslexic students from n=47 to n=36. Comparing the new sample mean ABC24 overall values between these two subgroups shows a low-medium effect size (g=0.40) between the absolute ABC values (60.3 (Control), 66.5 (Test)) with a t-test outcome that is close-to-significant at the 5% level (t=1.646 , p=0.0523) but this does indicate that overall, academic confidence of quasi-dyslexic students substantially exceeds that for dyslexic students. The difference is more pronounced between the Control and the Base subgroups (60.3 (Control), 69.2 (Base) g=0.61, t=2.619, p=0.0054) represented by a large-medium effect size and a t-test outcome that is highly significant at the 1% level showing that a non-dyslexic students are presenting a strongly elevated academic confidence in comparison to their dyslexic peers when the data is re-analysed according to the Dyslexic Index Factor, Working Memory. In both comparisons, it is ABC Factor 2, Engagement, which appears to be making the most significant contribution to the overall effect size differences (g=0.64 Control/Test, ABC24-2: 48.9/61.2; g=0.70 Control/Base, ABC24-2: 48.9/70) which in both cases is supported by a t-test outcome indicating highly significant differences at the 1% level (Control/Test: t=2.602, p=0.0057; Control/Base: t=3.036 , p=0.0017).
Some respondents reported issues of memory in their questionnaire submissions:
- "I find exams [particularly] stressful as I feel [they] are a memory test even though they may be posed as 'not a memory test' ... [and] my anxiety gets in the way of my concentration and memory for exams" (Respondent #44317730; RG:DI; ABC24 = 54.6; Dx = 563.23)
- "My learning difficulty is related to my working memory" (Respondent #99268333; RG:ND (DNI); ABC24 = 47.9; Dx = 654.82)
- "Having dyslexia ... sometimes affects the memory where in the moment you forget everything and don't know what you need to write" (Respondent #11098724; RG:DI; ABC = 62.4; Dx = 679.84)
although amongst all comments submitted, those that referred to memory constituted only a small proportion (5/78 = 6.4%). With hindsight and a better understanding of cognitive load theory (Sweller, 1988) at the time, designing these two dimensions of the Dyslexia Index Profiler more carefully may have generated outcomes that were more meaningful and relevant to the wider issues in the literature related to working memory in students with dyslexia. especially in the light of the dual-channel theory which suggests that information is processed through both an auditory and a visual channel in working memory (Baddeley, 1995 in Knoop-van Campen et al, 2018) working in parallel in ways that generate cognitive load in the working memory, that is, the amount of information that can be accommodated at a time.
Sifting the datapool by Dx Factor - summary
Although the matrix highlights many interesting feature and differences which will be discussed further below, it is significant to note that when the datapool is sifted according to Dx Factor 1: Reading, Writing, Spelling, the differences in Academic Behavioural Confidence between students with dyslexia in the Test subgroup and those with quasi-dyslexia, which may imply an unidentified dyslexia, in the Control subgroup, are small and statistically not significant neither for the overall ABC value nor for any of the ABC factor values with the exception of ABC Factor 4, Attendance where students in the Control subgroup present a higher ABC24-4 mean value than their peers in the Test subgroup. This may be suggesting that where students in each of these research subgroups respectively may be presenting similar levels of dyslexia-related issues in the context of literacy skills, these do not impact significantly on differences in levels of academic behavioural confidence. Although at face value this might be considered as a surprising outcome, it could be consistent with arguments which support the view that for many dyslexic individuals operating at the higher levels of academic capability required at university, earlier literacy difficulties associated with their dyslexia which may have been apparent in pre-university learning and indicated through value outputs in dimensions of the Dyslexia Index Profiler that have enquired about these early-learning challenges, may have responded to the development of strategies and compensations that have made literacy challenges less problematic. Whereas by sifting the datapool according to all of the other four Dx Factors, differences in ABC are more pronounced and supported by effect sizes ranging from medium (g=0.45) when the datapool is sifted according to Dx Factor 2, Thinking and Processing, to large (g=0.78) when Dx Factor 3, Organization and Time-management is the sort parameter.
[another para or two to write]
4.4 Applying multiple regression analysis
Multiple regression analysis has been used in education contexts to attempt to predict whether dyslexia exists or not amongst students with suspected dyslexia. For example, Tops et al (2012) analysed data collected from a sample of 200 Dutch university students which was split equally between those with a known dyslexia and a Control subgroup of those with no known dyslexia nor any previous evidence of it. Based on several independent variables, these comprising a plethora of subtests regularly associated with attempts to identify dyslexia such as for assessing short-term memory, phonological awareness, rapid-naming skills, a predictive model was generated based on a multiple regression analysis. Of particular note was an important element of the research design whereby each dyslexic individual was matched with a control-group ‘data-partner’ using matching criteria of age, gender and field of study. Though not explicitly stated, it is presumed that this feature of the research design intended to eliminate the likelihood of confounding analysis results that might be attributable to these variables. But the most important feature of the study was the derivation of a prediction equation that enabled a probability indicator of dyslexia to be generated based on each individual's test score outputs. It was claimed that this study was the first to bring prediction analysis to the field of dyslexia research (ibid) in order to convert multi-test data into interpretable dyslexia probabilities. Perhaps at the time the authors were unaware of a prior study which had also attempted to create a multivariate predictive model for identifying dyslexia, albeit in young learners rather than for adults (le Jan et al, 2009). Although there were methodological differences between the two studies, not least where le Jan's study utilized a combination of principal component analysis of the multi-variable data collected together with logistic rather than multiple regression analysis, the outcome was also a predictive model which 'evaluated the percentage of similarity between test outputs and dyslexia symptoms' (ibid, p18) and for which the research conclusions claimed high levels of sensitivity and specificity.
Hence the application of multi-variable regression analysis was considered to have value in this current study although rather than use this process to predict dyslexia, the aim has been to explore the predictive validity for indicating levels of Academic Behavioural Confidence based on Dyslexia Index, given that the Dyslexia Index Profiler developed in this study also uses a multivariable design. However of greater value will be to use the generated prediction equations based on the research groups and subgroups in this project to add further evidence to the research hypothesis that students with quasi-dyslexia, which may be unidentified dyslexia, return higher levels of Academic Behavioural Confidence than their dyslexia-identified peers. It is recognized that this extension of the research design can only be tentatively explored within the scope of this thesis but early indications are that there may be merit in pursuing this avenue of research in a future project.
It is understood that a simple linear regression explores the relationship between two continuous variables so that the value of a dependent variable might be predicted on the basis of an independent variable. The scatterplot (Figure 35) shows the distribution of the complete datapool in this project and given the simple, linear regression analysis conducted in Excel. It can be seen that there is an association between Academic Behavioural Confidence and Dyslexia Index, indicated by the line of best fit overlaid through the distribution with an R2 value (effect size) of 0.2052, from Pearson’s coefficient of correlation, r = 0.453. This demonstrates a medium correlation although of course, this interrelationship does not necessarily imply a causation.
Given that the Dyslexia Index (Dx) scale comprises 20 scale items, it was considered that a multiple regression analysis may reveal more about the interrelationship between Academic Behavioural Confidence (ABC) and Dyslexia Index. Rather than using this procedure to explore whether it is possible to predict ABC from Dx – which although is valid and relevant, should be the topic of a further study later – the aim has been to determine whether a multiple regression analysis might add further weight to the research hypothesis that students with a quasi-dyslexia present higher levels of ABC than their dyslexia-identified peers. In keeping with this clear aim, SPSS was used with the existing datapool to generate a predictive model with Academic Behavioural Confidence as the dependent ‘output’ variable and each of the 20 dimensions of the Dyslexia Index scale as multi-variable inputs. The objective was to compare each participant’s predicted ABC against their actual ABC taken from their questionnaire responses and also to build mean-average ABC outputs for each of the research groups and subgroups for a broader comparison to be possible. Recall that the datapool is divided into two, clear research groups – students with declared dyslexia (RG:DI), and students who had declared no dyslexic learning differences (RG:ND), the multiple regression analysis would be applied to the datasets in each research group separately to generate two predictive models. Since Research Group ND also contained a subset of students with quasi-dyslexia, (research subgroup DNI, the Test subgroup), it would be possible to use the predictive model for ABC for dyslexic students to generate ABC outputs for students in the Test subgroup to compare with the actual ABC of these students generated from their questionnaire responses. The desired result would be one that demonstrated that the quasi-dyslexic students’ actual ABC was higher than it should be according to the predictive output from the regression model for dyslexic students.
In total, five multiple regression analyses were conducted through SPSS in order to generate five distinct regression equations and in each case, the aim was to see how closely the predicted ABC output matched the actual ABC output based on students’ questionnaire responses. The five analyses conducted sought six prediction outcomes:
- to predict Academic Behavioural Confidence based on the regression equation derived from Dyslexia Index (Dx) using data from the complete datapool;
- to predict ABC for students in Research Group ND based on the regression equation derived from Dx data from that research group;
- to predict ABC for students in Research Group DI based on the regression equation derived from Dx data from that research group;
- to predict ABC for students in Research Subgroup ND-400, the Base subgroup, based on the regression equation derived from Dx data for that research subgroup;
- to predict ABC for students in Research Subgroup DI-600, the Control subgroup, based on the regression equation derived from Dx data for that research subgroup;
- to predict ABC for students in Research Subgroup DNI, the Test subgroup, based on the regression equation derived from Dx data for research subgroup DI-600.
In each of the six cases, the objective was to compare the mean predicted ABC to the mean actual ABC where the closeness of match would be at least an ‘eyeball’ indicator of the predictive strength of the models, but especially in case VI it was hoped to demonstrate that students in the Test subgroup, the quasi-dyslexic students, presented on average a higher level of Academic Behavioural Confidence than they should do, based on their Dyslexia Index.
The summary of outcomes (right) shows the mean ABC values for each of the research groups and subgroups calculated from observed data which is compared with the mean ABC values generated from the predictive models. Given that the predictive models were generated from the observed data it is of no surprise that the discrepancies between actual and predicated mean ABC values are generally small. For example, for research group DI the observed mean ABC=58.45 is only 0.03 points adrift from the predicted mean ABC=58.42 using the regression equation built from this research group’s observed data.
However it is of note that for the research subgroup DNI, which is the Test subgroup of quasi-dyslexic research participants, it is apparent that the observed mean ABC=64.92 is 3.08 points above the predicted mean ABC=61.84 using the predictive model built from Control group data (research subgroup DI-600) and an even greater 3.74 points above the predicted mean ABC=61.18 generated from the predictive model built from the complete datapool.
Although it is recognized that a much deeper inspection of these analysis outcomes is called for to properly understand their relevance and validity, at face value they appear to support the desired outcome that students with a quasi-dyslexia present better than expected levels of Academic Behavioural Confidence.
Analysis summary
Distill the key findings from the analysis above into a summary paragraph and series of bullet points.
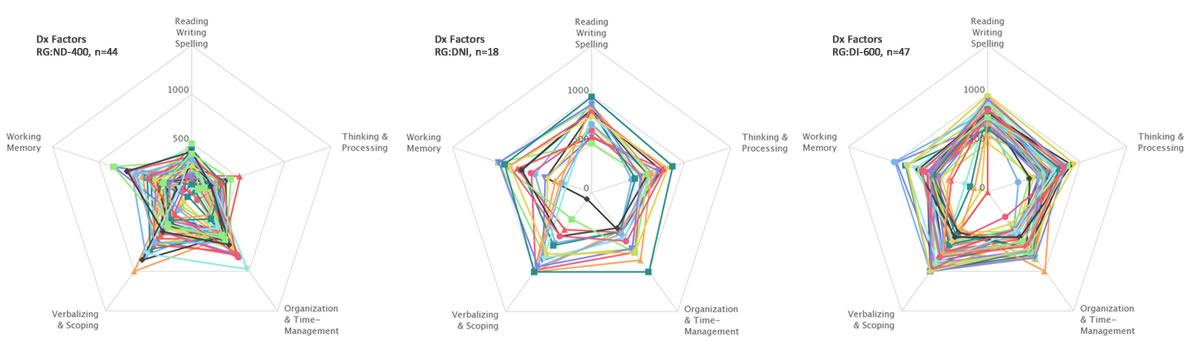


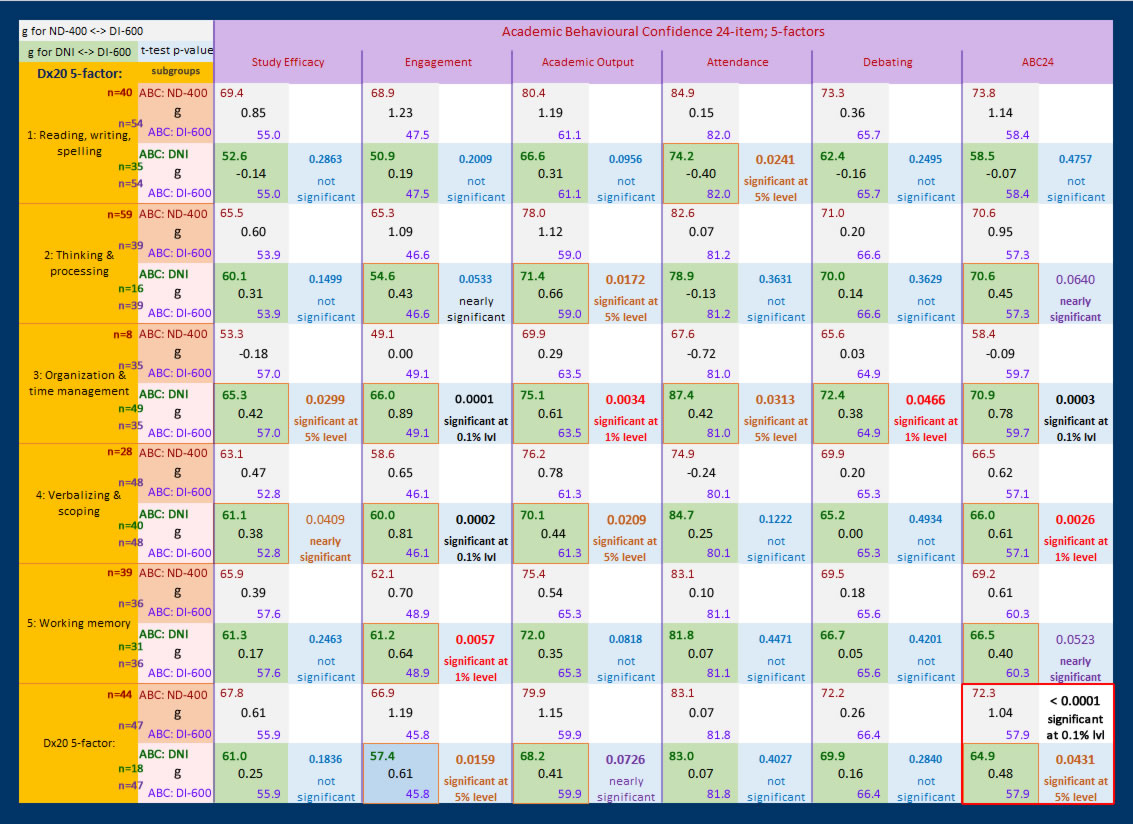
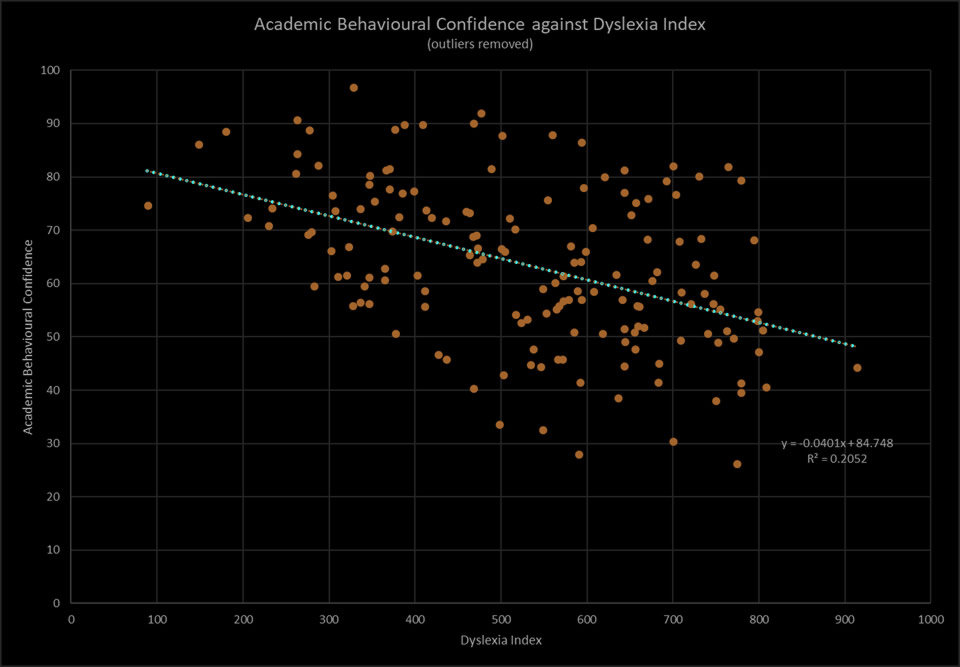
| THESIS | INTRODUCTION > | < THESIS | THEORETICAL PERSPECTIVES > | < THESIS | RESEARCH DESIGN > | < THESIS | ANALYSIS & DISCUSSION > | < THESIS | CONCLUDING REFLECTIONS |
| +44 (0)79 26 17 20 26 | www.ad1281.uk | ad1281@live.mdx.ac.uk | This page last edited: June 2018 |