
| w | statement | H / L | r | RC ? |
| 0.80 | When I was learning to read at school, I often felt I was slower than others in my class | H | 0.62 | - |
| 0.53 | My spelling is generally very good | L | - 0.51 | RC |
| 0.70 | I find it very challenging to manage my time efficiently | H | 0.15 | - |
| 0.71 | I can explain things to people much more easily verbally than in my writing | H | 0.45 | - |
| 0.57 | I think I am a highly organized learner | L | - 0.08 | - |
| 0.48 | In my writing I frequently use the wrong word for my intended meaning | H | 0.73 | - |
| 0.36 | I generally remember appointments and arrive on time | L | -0.10 | - |
| 0.75 | When I'm reading, I sometimes read the same line again or miss out a line altogether | H | 0.67 | - |
| 0.76 | I have difficulty putting my writing ideas into a sensible order | H | 0.70 | - |
| 0.80 | In my writing at school, I often mixed up similar letters like 'b' and 'd' or 'p' and 'q' | H | 0.60 | - |
| 0.57 | When I'm planning my work I use diagrams or mindmaps rather than lists or bullet points | neutral | 0.47 | - |
| 0.75 | I'm hopeless at remembering things like telephone numbers | H | 0.44 | - |
| 0.52 | I find following directions to get to places quite straightforward | L | -0.08 | - |
| 0.57 | I prefer looking at the 'big picture' rather than focusing on the details | neutral | 0.24 | - |
| 0.63 | My friends say I often think in unusual or creative ways to solve problems | H | 0.41 | - |
| 0.52 | I find it really challenging to make sense of a list of instructions | H | 0.54 | - |
| 0.52 | I get my 'lefts' and 'rights' easily mixed up | H | 0.45 | - |
| 0.70 | My tutors often tell me that my essays or assignments are confusing to read | H | 0.58 | - |
| 0.64 | I get in a muddle when I'm searching for learning resources or information | H | 0.64 | - |
| 0.72 | I get really anxious if I'm asked to read 'out loud' | H | 0.55 | - |
project outline | design | post-project
discourse study-blog | resources | lit review maps | profiles
enquiry dysdefs QNR | dysdims QNR | research QNR
thesis overview | literature | research design | analysis & discussion | closing reflections
discourse study-blog | resources | lit review maps | profiles
enquiry dysdefs QNR | dysdims QNR | research QNR
thesis overview | literature | research design | analysis & discussion | closing reflections
 Draft (2017-18)
Academic confidence and dyslexia at university

Research design
This section opens by refreshing the aims and objectives of the project and outlining the principal elements of the research design.
This is followed by a reminder about the metrics that are used in the data collection and subsequently in the quantitative analysis, and summarizes why these were appropriate in the context of the theoretical underpinnings of the project. A short section follows which reiterates my intrinsic stance on the project, but which also states my position on research methodology processes in level 8 study and how this has impacted on not only the design of the data collection tools but also on my own personal learning development journey.
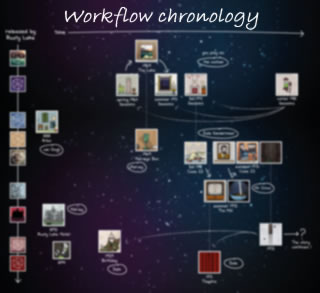
The methodology for the project is explained through use of a workflow chronology as I considered this to be the most expedient way to document the journey from research question to data collection and analysis. Particular attention is given to this project's unique perspective on quantifying dyslexia-ness in higher education students with a lengthy report being provided which describes the process of development of the Dyslexia Index Profiler that has been used to gauge dyslexia-ness in this study, this being the independent variable in the quantitative analysis. This includes an account of the processes applied to determine levels of internal reliability consistency and how this influenced the analysis->re-analysis cycle that was used to try to arrive at the most dependable analysis outcomes.
In the Methods section which follows, an account is provided about how the research questionnaire was constructed and deployed which includes reports of difficulties and challenges encountered - technical, ethical and practical - and how these were overcome. Difficulties that the use of Likert-style items and scales present to the quantitative researcher are briefly discussed which outline the statistical tensions created through the conventional use of fixed anchor-point scales, the non-parametric data that these provide and a tendency for researchers to manipulate such data so that parametric statistical tests can be applied, a practice which it is argued can render the meaning derived from such data analysis procedures as dubious in many circumstances. Hence particular attention is paid to explaining how I tried to mitigate these effects through the development of continuous-range scales in the research questionnaire as a mechanism to replace traditional, discrete, fixed anchor-points in the Likert-scale items that I used.
This section concludes by describing the process of multifactoral analysis that has been applied to data collected for both metrics, and especially for the Dyslexia Index metric, relating the pertinence of this given that dyslexia in higher education contexts is increasingly being researched through the lens of multifactorialism. Attention is given to reporting why this was considered useful and also how it enabled the data to be iteratively analysed-re-analysed to try to identify more specifically the combinations of factors of Dyslexia Index and of Academic Behavioural Confidence that were the most influential in explaining differences in academic confidence between dyslexic, non-dyslexic and quasi-dyslexic students at university.
Complete Thesis Contents
- ABSTRACT
- ACKNOWLEDGEMENTS
- PROJECT OVERVIEW
- RESEARCH QUESTIONS
- STANCE
- RESEARCH IMPORTANCE
-
 THEORETICAL PERSPECTIVES
-
 DYSLEXIA
- A complex phenomenon or a psuedo-science?
- Dyslexia: the definition issues
- Dyslexia as a multifactoral difference
- Disability, deficity, difficulty, difference or none of these?
- Labels, categories, dilemmas of difference, inclusivity
- Impact of the process of identification
- To Identify or Not To Identify? - that is the question
- Measuring dyslexia - "how dyslexic am I?"
- ACADEMIC CONFIDENCE - theoretical foundations of the construct
- ACADEMIC SELF-EFFICACY - the parent construct for academic confidence
- The construct of academic self-efficacy
- The relationships between academic self-efficacy and academic achievement
- Confidence as a learning attribute
- The location of academic confidence within the construct of academic self-efficacy
- Academic Behavoural Confidence
- Use of the ABC scale in this research project
-
- RESEARCH DESIGN
- RESULTS, ANALYSIS and DISCUSSION
- LIMITATIONS
- CONCLUSIONS
- DIRECTIONS FOR FUTURE RESEARCH
- REFERENCES
- APPENDICES
Research Design
Research Design Section Contents:
- OVERVIEW
- METHODOLOGY
- Stance
- Workflow chronology
- The preceding MSc small-scale enquiry
- Defining dyslexia: the professional practitioners' view
- Existing dyslexia evaluators and identification processes - why these were dismissed
- Rationale for developing the Dyslexia Index Profiler
- Operationalizing academic confidence through the Academic Behavioural Confidence Scale
- Collecting information - the rationales, justifications and challenges
- METHODS
- Outline
- Establishing the datapool; sample sizes and statistical power; participant recruitment
- Procedures for data collection, collation and pre-analysis
- Designing and building a web-browser-based electronic questionnaire
- Questionnaire design rationales
- Questionnaire construction and the HTML5 scaffolding
- Questionnaire sections and components
- participant demographics
- gauging academic confidence: the ABC Scale
- the 6 psycho-sociometric constructs
- gauging dyslexia-ness: the Dyslexia Index Profiler
- supporting qualitative data
- The ABC Scale (justification for use)
- Development and construction of the Dyslexia Index (Dx) Profiler:
- The final, published version of the research questionnaire
- Designing and building a web-browser-based electronic questionnaire
- Statistical tools and processes:
- Use of the t-test in preference to ANOVA
- Effect size
- Principal Component Analysis
- Research Design section summary
Overview
 The aims and objectives of this research project together with the clear research questions have been set out in the opening sections of this thesis.
This section, reporting on the Research Design, describes the blueprint for the strategic and practical processes of the project that were informed at the outset by the researcher's previous Master's dissertation, subsequently by the relevant literature - including identifying where gaps in existing knowledge became evident - and not least by the researcher's deep desire, as a learning practitioner in higher education, to explore how dyslexic students perceive the impact of their dyslexia on their study behaviours, attitudes and processes at university - collectively gauged through the lens of academic confidence - in comparison with their non-dyslexic peers. A particular focus has been to consider how an individual's knowledge and awareness of their dyslexia can be a significant factor, possible more so than the challenges and learning issues that their dyslexia may present in a learning environment that remains steadfastly literacy-based. The research design has attempts to address this by comparing levels of academic confidence between dyslexic students and their quasi-dyslexic peers. In addition to conducting a study in this under-researched area which is highly interesting in itself, the driving rationale has been that the outcomes of the research might usefully contribute to the gathering discourse about how knowledge acquisition, development and creation processes can be transformed in higher education in ways that more significantly adopt principles of equity, social justice and universal design (Lancaster, 2008, Passman & Green, 2009, Edyburn, 2010, Cavanagh, 2013), because it is argued that this may be a comprehensive learning solution that may mitigate or even nullify the impact of a dyslexic learning differences at university. This is approach is supported by an argument gaining traction that dyslexia may now be best considered as an alternative form of information processing (Tamboer et al, 2014) rather than a learning disability (eg: Heinemann et al, 2017, Joseph et al, 2016, amongst numerous other studies).
Descriptions are provided about how practical processes have been designed and developed to enable appropriate data sources to be identified and how data has been collected, collated and analysed so that the research questions can be properly addressed. The rationales for research design decisions are set out and justified, and where the direction of the project has diverted from the initial aims and objectives, the reasons for these changes are described including the elements of reflective processes that have underpinned project decision-making and re-evaluation of the focus of the enquiry where this has occurred. The originality of the research rationale will be emphasized and justification made as to the equally original final presentation of the project outcomes where this will be a combination of this traditionally-written thesis and an extensive suite of webpages that have been constructed by the researcher as part of the learning development process that this doctorate-level study has contributed to. The project webpages have served as a sandbox for project ideas and development of some of the technical processes, particularly related to data collection and for diagramatically representing data outputs. The webpages have also diarized the project, contain a reflective commentary on the project's progress throughout its 3-year timescale through a Study Blog; and contain, present and visualize the data collected. An electronic version of the final thesis is published on the project webpages, notably so that pertinent links to supportive, online material contained elsewhere on the webpages can be easily accessed by the reader.
Design focus
This primary research project has taken an explorative design focus because little is known about the interrelationships between the key parameters being investigated and so no earlier model has been available to provide guidance. The main emphasis has been to devise research processes which are able to establish empirical evidence to support previously anecdotally observed features of study behaviour and attitudes to learning amongst the dyslexic student community at university. These were study characteristics that appeared to the researcher to be driven more so by students' feelings about their dyslexia and what being identified as 'dyslexic' meant to their study self-identity rather than ones that might be expected to be more directly influenced by the obstacles and impediments to successful academic study, apparently attributable to their dyslexia, when functioning in a literacy-based learning environment. This was first explored in the Master's research dissertation (Dykes, 2008) which preceded this PhD project, is available here, and which has contributed to this current project as a virtual pilot study.
The fundamental objective has been to establish a sizeable research group datapool that comprised two principal subgroups: the first was to be as good a cross-section of higher education students as may be returned through voluntary participation in the project; the second was to be a control group of students known to have dyslexic learning differences by virtue of a) acquiring them as participants through a request targeted specifically at the university's dyslexic student community, and b) through their corresponding self-disclosure in the project questionnaire. In this way, it was felt that it could be assumed that students recruited from this cohort will previously have been formally identified as dyslexic through one or more of the currently available processes, for example as an outcome from an assessment by an educational psychologist either prior to, or during their time at university. Subsequently, the research aim was twofold: firstly to acquire a sense of all research participants' academic confidence in relation to their studies at university; secondly to establish the extent of all participants' 'dyslexia-ness' and this has been a key aspect of the project design because from this, it was planned that students with dyslexia-like profiles - marked by their high levels of dyslexia-ness - might be identified from the research subgroup of supposedly non-dyslexic students. Quantitative analysis of the metrics used to gauge these criteria have addressed the primary research questions which hypothesize that knowing about one's dyslexia may have a stronger negative impact on academic confidence than not knowing that one may have learning differences typically associated with dyslexia. Given that this is established, it will be suggesting that labelling a learner as dyslexic may be detrimental to their academic confidence in their studies at university, or at best, may not be as useful and reliable as previously believed (Elliott & Grigorenko, 2014).
The research design devised an innovative process for collecting original data by utilizing recently developed enhanced electronic (online) form design processes (described below), analysed it and interpreted the analysis outcomes in relation to the research questions posed at the outset and to existing literature. The research participants were all students at university and no selective nor stratified sampling protocols were used in relation to gender, academic study level or study status - that is, whether an individual was a home or overseas student - although all three of these parameters were recorded for each participant respondent and this data has been used throughout the analysis and discussion when considered apposite. For students recruited into the dyslexic students research subgroup, information was also collected in the questionnaire which recorded how these students learned of their dyslexia because it was felt that this may be pertinent to the discussion later relating to the effects of stigmatization on academic study. A dissemination of the results, together with a commentary is presented below and incorporated into the discussion section of this thesis where this has been helpful in trying to understand what the outcomes of the data analysis mean. It is anticipated that a more comprehensive analysis and discussion about this aspect of the study may be warranted later as a development of this current project.
 The research design has adopted a mixed methods approach although the main focus has been on the quantitative analysis of data collected through the project's participant self-report questionnaire. The questionnaire has been designed and developed for electronic deployment through the research project's webpages and participants were recruited voluntarily on the basis of responding to an intensive period of participant-request publicity kindly posted on the university's main, student-facing webpages for a short period during the academic year 2015-16, and also through the researcher's home-university Dyslexia and Disability Service student e-mail distribution list. The raw score data was collected in the questionnaire using a Likert-style item scales although the more conventionally applied, fixed anchor point scale items, typically using 5 or 7 anchor-points, have been discarded in favour of a continuous scale approach which has been uniquely developed for this project by taking advantage of new online form processes now available for incorporation into web-browser page design. The rationale for adopting continuous Likert scale items has been to try to mitigate the typical difficulties associated with anchor-point scales where the application of parametric statistical processes to non-parametric data is of questionable validity because data collected through typically 5- or 7-point scales needs to be coded into a numerical format to permit statistical analysis. The coding values used are therefore arbitrary and coarse-grained and hence controversy relates to the dilemma about using parametric statistical analysis processes with what is effectively non-parametric data - that is, it is discrete, interval data rather than continuous. (Jamieson, 2004, Pell, 2005, Carifio & Perla, 2007, Norman, 2010, Brown, 2011, Murray, 2013). The advent of this relatively new browser functionality has seen electronic data-gathering tools begin to use input-range sliders more readily, especially in the collection of measurements of constructs that are representative individual characteristics, typically personality or other psychological characteristics following additional evidence that doing so can also reduce the impact of input errors (Ladd, 2009). Through using input-range slider functionality this is addressing many of the issues in the parametric/non-parametric debate because the outputs generated, although technically still discrete because they are integer values, nevertheless provide a much finer grading and hence may be more justifiably used in parametric analysis.
In addition to recording value scores, research participants were also encouraged to provide qualitative data if they chose to, which has been collected through a 'free-text' writing area provided in the questionnaire. The aim has been to use these data to add depth of meaning to the hard outcomes of statistical analysis where this has been considered helpful and appropriate.
This method of data collection has been chosen because self-report questionnaires have been shown to provide reliable data in dyslexia research (eg: Tamboer et al, 2014, Snowling et al, 2012); because it was important to recruit participants widely from across the student community of the researcher's home university and if possible, from other HE institutions (although only two others responded to the invitation to participate); because it was felt that participants were more likely to provide honest responses in the questionnaire were they able to complete it privately, hence avoiding any issues of direct researcher-involvement bias; and because the remoteness of the researcher to the home university would have presented significant practical challenges were a more face-to-face data collection process employed.
So as to encourage a good completion rate, the questionnaire was designed to be as simple to work through as possible whilst at the same time eliciting data covering three broad areas of interest. Firstly, demographic profiles were established through a short, introductory section that collected personal data such as gender, level of study, and particularly whether or not the participant experienced any specific learning challenges; the second section presented verbatim the existing, standardized Academic Behavioural Confidence Scale as developed by Sander & Sanders (2006, 2009) as the metric for gauging participants' academic confidence that has been tested in other studies researching aspects of academic confidence in university students (eg: Sander et al, 2011, Nicholson, et al, 2013, Hlalele & Alexander, 2011). Lastly, a detailed profile of each respondent's study behaviour and attitudes to their learning has been collected and this section formed the bulk of the questionnaire. The major sub-section of this has been the researcher's approach to gauging the 'dyslexia-ness' of the research participants and care has been taken throughout the study to avoid using value-laden, judgmental phraseology such as 'the severity of dyslexia' or 'diagnosing dyslexia' not least because the stance of the project has been to project dyslexia, such that it might be defined in the context of university study, as an alternative knowledge acquisition and information processing capability where students presenting dyslexia and dyslexia-like study profiles might be positively viewed as being neurodiverse rather than learning disabled.
Metrics
Academic confidence has been assessed using the existing, Academic Behavioural Confidence Scale because there is an increasing body of research that has found this to be a good evaluator of academic confidence presented in universlty-level students' study behaviours. Secondly, no other metrics have been found that explicitly focus on gauging confidence in academic settings (Boyle et al, 2015) although there are evaluators that measure self-efficacy and more particularly academic self-efficacy, which, as described earlier, is considered to be the umbrella construct that includes academic confidence. Hence, the Academic Behavioural Confidence Scale is particularly well-matched to the research objectives of this project and comes with an increasing body of previous-research credibility to support its use in the context of this study. A more detailed profile of the ABC Scale has been discussed earlier.
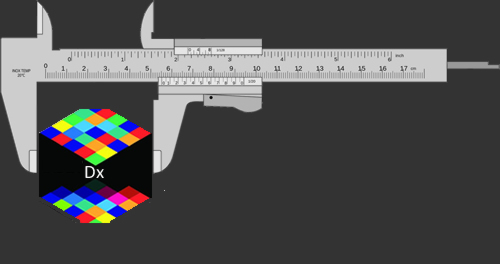 Dyslexia-ness has been gauged using a profiler designed and developed for this project as a dyslexia disrciminator that could identify, with a sufficient degree of construct reliability, students with apparently dyslexia-like profiles from the non-dyslexic group. It is this subgroup of students that is of particular interest in the study because data collected from these participants were to be compared with the control subgroups of students with identified dyslexia and students with no indication of dyslexia. For the purposes of this enquiry, the output from the metric has been labelled as Dyslexia Index (Dx), although the researcher acknowledges a measure of disquiet at the term as it may be seen as contradictory to the stance that underpins the whole project. However, Dyslexia Index at least enables a narrative to be contructed that would otherwise be overladen with repeated definitions of the construct and process that has been developed.
Designing a mechanism to identify this third research subgroup of quasi-dyslexic students has been one of the most challenging aspects of the project. It was considered important to develop an independent means for quantifying dyslexia-ness in the context of this study in preference to incorporating existing dyslexia 'diagnosis' tools for two reasons: firstly, an evaluation that used existing metrics for identifying dyslexia in adults would have been difficult to use without explicitly disclosing to participants that part of the project's questionnaire was a 'test' for dyslexia. It was felt that to otherwise do this covertly would be unethical and therefore unacceptable as a research process; secondly, it has been important to use a metric which encompasses a broader range of study attributes than those specifically and apparently affected by literacy challenges not least because research evidence now exists which demonstrates that students with dyslexia at university, partly by virtue of their higher academic capabilities, many have developed strategies to compensate for literacy-based difficulties that they may have experienced earlier in their learning histories. This has been discussed earlier in this thesis report. But also because in higher education contexts, research has also revealed that other aspects of the dyslexic self can impact significantly on academic study and that it may be a mistake to consider dyslexia to be only a literacy issue or to focus on cognitive aspects such as working memory and processing speeds (Cameron, 2015). In particular, those processes which enable effective self-managed learning strategies to be developed need to be considered (Mortimore & Crozier, 2006), especially as these are recognized as a significant feature of university learning despite some recent research indicating at best marginal, if not dubious, benefits of self-regulated learning processes when compared with traditional learning-and-teaching structures (Lizzio & Wilson, 2006). Following an inspection of the few, existing dyslexia diagnosis tools considered applicable for use with university-level learners (and widely used), it was concluded that these were flawed for various reasons (as discussed earlier) and unsuitable for inclusion in this project's data collection process. Hence, the Dyslexia Index Profiler has been developed and, as the analysis report details below, appears to have fulfilled its purpose for discriminating students with dyslexia-like study characteristics from others in the non-dyslexic subgroup.
It is important to emphasize that the purpose of the Dyslexia Index Profiler is not to explicitly identify dyslexia in students, although a subsequent project might explore the feasibility of developing the profiler as such. The purpose of the Profiler has been to find students who present dyslexia-like study profiles such that these students' academic confidence could be compared with that of students who have disclosed an identified dyslexia - hence addressing the key research question relating to whether levels of academic confidence might be related to an individual being aware of their dyslexia or dyslexia-like attributes. From this, conjecture about how levels of academic confidence may be influenced by the dyslexia label may be possible.
Analysis and results
A detailed presentation about the methods used to analyse the data and the reasons for using those processes is provided, which includes a reflective commentary on the researcher's learning development in statistical processes where this adds value to the methods description. It is recognized that even though this is a doctoral level study, the level of statistical analysis that is used has had to be within the researcher's grasp both to properly execute and to understand outputs sufficiently to relate these to the research hypotheses. Invaluable in achieving these learning and research processing outcomes has been firstly a good understanding of intermediate-level statistical analysis, a degree of familiarity with the statistical analysis software application, SPSS, where much credit is also given to the accompanying suite of SPSS statistical analysis tutorials provided by Laerd Statistics online, which it is felt has both consolidated the researcher's existing competencies in statistical processes as well as providing a valuable self-teach resource to guide the understanding and application of new analysis tools and procedures.
Recall that the aim of the enquiry is to determine whether statistically significant differences exist between the levels of Academic Behavioural Confidence (ABC) of the three, principal research subgroups. The key, statistical outputs that have been used to establish this are the T-test for differences between independent sample means together with Hedges' 'g' effect size measures of difference. These are important outputs that can permit a broad conclusion to be drawn about significant differences in Academic Behavioural Confidence between the research subgroups, however a deeper exploration using Principal Component Analysis (factor analysis) has also been conducted on not only the results from data collected using the Academic Behavioural Confidence Scale but also of the Dyslexia Index metric which has enabled a matrix of T-test outcomes and effect sizes to be constructed. This has been a useful mechanism for untangling the complex interrelationships between the factors of academic behavioural confidence and the factors of dyslexia (as determined through the Profiler), and has contributed towards trying to understand which dimensions of dyslexia in students at university appear to have the most significant impact on their academic confidence in their studies.
![]()
[3673 / 63,074 (at 18 Jul 2018)]
 Research Questions
- Do university students who know about their dyslexia present a significantly lower academic confidence than their non-dyslexic peers?
If so, can particular factors in their dyslexia be identified as those most likely to account for the differences in academic confidence and are these factors absent or less-significantly impacting in non-dyslexic students?
- Do university students with no formally identified dyslexia but who show evidence of a dyslexia-like learning and study profile present a significantly higher academic confidence than their dyslexia-identified peers?
If so, are the factors identified above in the profiles of dyslexic students absent or less-significantly impacting in students with dyslexia-like profiles?
How can these results be explained? Are the analysis outcomes sufficiently robust to suggest that identifying dyslexia in university student may be detrimental to their academic confidence? Further, that an identification of dyslexia may therefore be academically counterproductive?
Methodology
The research methodology for the enquiry is set out below as a workflow chronology as this serves to divide the reporting of how the research process has unfolded into ordered descriptions and justifications of the component parts of the project. In these, reference is made to pertinent methodology theory subsections where appropriate, and the extent to which, and reasons why this has been embraced or challenged. The workflow chronology is prefaced by a foreword which sets out the researcher's stance on the conventions of this part of a major, individual research enquiry which serves to underpin the chronology subsequently reported.
 Stance - a perspective on the natire of social science
Science concerns finding out more about the nature of the natural and social world through systematic methodology based on empirical evidence (Science Council, 2017). Social science does not appear to be as objective as 'regular' science. 'Social' can be taken to mean as relating to human society and all of us in it and by its very nature is complex, multifactorial and sometimes convoluted. Observing and attempting to explain the activities of the world's peoples and the diversity of their functioning within it is surely the evidence. The methodology of social science research arguably attempts to unravel the ethnography of human attitudes, behaviour and interrelationships in ways which might however, isolate behavioural, attitudinal or societal variables from their interrelated co-variables. This happens as a result of devising methods and processes to observe and analyse behaviours or attitudes and subsequently attempt to explain results that may be difficult to interpret and gain meaning from so as to formulate conclusions with a degree of conviction or certainty. It seems clear to this researcher at least, that most research studies in the Social Sciences, of which education research may be considered one branch, are incremental in nature, generally conservative in the research approach adopted and more often than not produce research outputs that may as much conflate knowledge as advance it. This seems to be particularly the case in research about educational and learning differences which are identified as atypical in comparison with supposedly normal learning characteristics, styles and attributes.
The overview in the Theoretical Perspectives section has summarized Bandura's strong argument in his Social Cognition Theory, decades in development, that people should be viewed as self-organizing, proactive, self-reflective and self-regulating and not merely reactive organisms shaped by environmental forces or inner impulses. Law (2004) strongly argues that the methods that are devised to explore complexities such as these do more than merely describe them because these methods are contingent on the research 'trend' at the time and may as much influence and create the social realities that are being observed as measure them. This is because the conventionality of the 'research methods' processes that we are taught, supposedly fully considered and perfected after a century of social science 'tend to work on the assumption that the world is properly to be understood as a set of fairly specific, determinate and more or less identifiable processes' (ibid, p5). But the alternative (i.e. Law's) viewpoint is to challenge this global assumption on the basis that the diversity of social behaviours, interactions and realities is (currently) too complex for us to properly know (= the epistemological discourse), and hence argues that consequently, the shape of the research should accommodate the kind of fluidity in its methodology that is responsive to the flux and unpredictable outcomes of the mixtures of components and elements that are the focus of the enquiry. If this mindset is adopted, then in follows - so the argument goes - that the research output might be all that more convincing. Taking this approach to devising and actioning a research methodology seems analogous to Kelly's view of the societies of peoples whereby individuals integrate with their societies as scientists [sic] and the mechanisms through which this is accomplished is by constructing representational models of their world realities so that they can navigate courses of behaviour in relation to it (Kelly, 1955).
This introduction to the Research Methodology thus sets out the researcher's standpoint on the constraints of prescriptive research processes because to follow them verbatim especially creates a tension between such an obedient mindset and the context within which this enquiry is placed and shaped - that is, one that challenges conventional analyses of learning difference and strives to locate it along a spectrum of diversity which equally challenges the traditional acceptance of neurotypical as 'normal' (Cooper, 2006) and everything else as an aberration. This means that although at the outset a fairly clear sense of what needed to be discovered as the product of the enquiry was constructed, elements of grounded theory as a research methodology have been part of the research journey which at times it must be admitted, has drifted a little towards reflecting on the aetiologies of both dyslexia and academic confidence rather than merely reporting them. But it has also been important to regularly re-document these reflections on both product and process which, despite a tentative acceptance of the Popkewitzian argument that research is more than the dispassionate application of processes and instruments because it needs to embrace the underlying values and shared meanings of the research community within which it is located (Popkewitz, 1984), in the field of dyslexia research, consensus about the nature and origins of the syndrome remains as yet an objective rather than a reality - as outlined at the top of this paper - an irony that flies in the face of, for example, Rotter's strongly argued proposition that the heuristic value of a construct is [at least] partially dependent on the precision of its definition (1990, p489).
Thus despite the indistinctness of shape and character that surrounds the dyslexia syndrome, the research design has tried hard to retain focus on the primary objective which has been to evidence that students with unidentified dyslexia-like profiles have a stronger sense of academic confidence than identified dyslexic students, and has attempted to develop an enquiry that traces a clear path through the somewhat contentious fog that is dyslexia research.
![]()
 Workflow chronology
Key steps in the workflow chronology are marked by learning and research process landmarks that have determined the final architecture of the project. This workflow chronology identifies and documents how these have influenced this enquiry and aims to present firstly how the researcher's interest in the impact of dyslexia on learning at university was kindled by learning practitioner experience, and as the project has progressed, how key realizations based on a better understanding of theory and careful reflection on how it has reshaped thinking migrated the research agenda onto a slightly different track:
- The preceding small-scale enquiry:
The legacy of outcomes from the researcher's preceding Masters' dissertation (Dykes, 2008) has had a significant impact on the development of this current project. As a preceding study, that small-scale enquiry within the dyslexic student community at a UK university was interested in understanding why some students with dyslexia were strong advocates of the learning support value provided by a dedicated learning technology suite staffed by dyslexia and disability specialists as evidenced through such students making frequent use of the suite and services throughout their time at university. Whereas at the same time, others with apparently similar dyslexic profiles appeared to be of the opposite disposition as these students rarely visited the technology suite or contacted the staff despite initially registering for access to the resources and services. It was thought that this disparity might, in part at least, be due to differences in the attitudes and feelings of students with dyslexia to their own dyslexia but particularly their perceptions about how it impacted on their access to, and their engagement with their learning at university. The study attempted to reveal these differences through exploration of (academic) locus of control as a determining variable by discriminating research participants into 'internalizers' or 'externalizers' as informed by the theories and evaluative processes widely acreditted to Rotter (1966, 1990). The hypothesis being considered was that students who did not use the learning technology suite and support services were likely to be internalizers whilst those who were regular 'customers' and frequently requested learning support from the staff, likely to be externalizers. This was formulated out of an extrapolation of the literature reviewed which suggested that externalizers were likely to be significantly more reliant on learning support services to help with and guide their studies in comparison to internalizers, who typically presented the more independent learning approaches generally observed amongst the wider student community. It was expected that this would be related to their attitudes and feelings about their dyslexia. As a member of staff of the suite at the time, privileged access to computer workstation log-in credentials was granted for the purposes of the research and this was used to determine which dyslexic students were frequent users of the service and which were not. Through a process of eliminating conflating variables, the research-participant base was established which eventually provided a sample size n=41 of which 26 were regular student users of the service and 15 were not. Data was collected through a self-report questionnaire which asked participants to rate their acquiescence using Likert-style responders to a selection of statements about learning and study preferences and about their feelings towards their dyslexia.
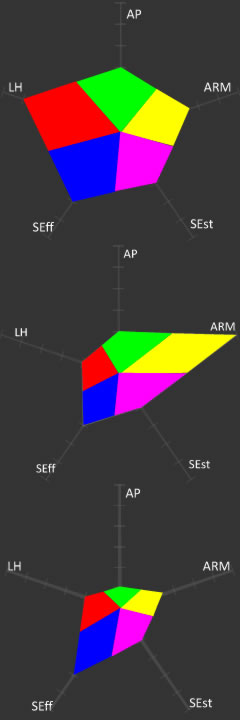
 By deconstructing academic locus of control into factors and structuring the questionnaire statements accordingly, some small but significant differences between student profiles did emerge after the data was analysed although overall, the results were inconclusive. However a valuable output of the study was the development of what were termed at the time, Locus of Control Profiles. An example of the profiles generated from three respondents' data is shown (right). These were diagrams that represented the numerical conversion of each participant's responses to elements of the data collection questionnaire that were then aggregated into 5 distinct factors that the literature had shown were often associated with locus of control. These factors were attempting to measure respectively: Affective Processes (AP), Anxiety regulation and Motivation (ARM), Self-Efficacy (SEff), Self-Esteem (SEst), and Learned Helplessness (LH) and each axis of the profile diagrams represented each of these factors. Due to the methods used to code the data collected from this section of the questionnaire, the magnitude of the area of the polygons generated in these profile diagrams represented the degree of internal locus of control presented by each participant. Greater areas represented higher levels of internal locus of control. Hence it was possible to differentiate internalizers from externalizers given boundary values which, it must be admitted now, were somewhat arbitrarily determined, but which nevertheless worked at the time and enabled an analysis process of sorts to be completed.
The factors emerged out of the literature review of the enquiry which had referred to many studies where levels of these constructs in learners with dyslexia were observed to have been siginificantly different than typically seen in non-dyslexic individuals (eg: Kerr, 2001, Burden & Burdett, 2005, Humphrey & Mullins, 2002, Riddick et al, 1999, Burns, 2000, Risdale, 2005). The literature also appeared to be showing that dyslexic individuals were more likely to be externalizers than internalizers in this locus of control context (eg: Bosworth & Murray, 1983, Rogers & Saklofske, 1985) because these individuals perceived, accurately or not, that their dyslexia would naturally put them at a learning disadvantage, not least due to their perception of their dyslexia as a learning disability rather than a learning difference in contemporary learning environments. Hence it was argued that these students would be expected to need additional support and resources in order to engage with their curricula on a more equal footing to their non-dyslexic peers. Originally the profiles were devised as a means to visually interpret and find meaning in the complex data that the enquiry had collected. No other studies had been found that presented multi-factoral outputs in a similar way and so in this respect, this representation of results in this way was highly innovative. On reviewing these individual participant-response profiles collectively, it was clear that they could be sifted into groups determined as much by striking similarities as by clear contrasts between them. The limitations of the enquiry recognized that there was much more information contained in these profile diagrams and their groupings than could be analysed and reported at the time and that these could be part of a further research project. It was also identified that a greater understanding of the relationships between the 5 factor constructs and locus of control and how these related to dyslexia in comparison to learners with no dyslexia was a necessary prerequisite for further work. It was also documented that an equally greater appreciation of 'due scientific process' would also be required for a later project especially in statistical analysis processes for example, gaining an understanding of what is now known to the researcher as principal component analysis. Despite this, it was recognized that the data generated through the self-report questionnaire were non-parametric, indeed with Likert-style attitudinal statements presented to participants with just two anchor-point choices - 'I generally agree with ...' or 'I generally disagree with...', the gradation of the data collected was extremely coarse. Clearer planning for the questionnaire design may have led to finer anchor-point gradings which would have facilitated a more cogent statistical argument to support the enquiry outcomes. Nonetheless, when this data was coded so that statistical analysis was possible, the non-parametric nature of the data collected was recognized, leading to use of the Mann-Whitney U and Kolgorov-Smirnoff Z tests to expose any significant differences between medians. It is of no surprise therefore, especially with hindsight and with the researcher's more recently acquired statistical competencies, that the outcomes of the analysis were inconclusive. But the project did uncover interesting realities about the feelings and attitudes of students with dyslexia to their learning at university and worth reporting amongst these were statistically significant differences between the attitudes of 'internalizers' and 'externalizers' to their perceptions of the intensity of study required to match the academic performance of their non-dyslexic peers, and also about their feelings about the university's provision for the perceived uniqueness-of-need of students with dyslexia, an observation that is consistent with the argument that by accepting the principles of Universal Design for Learning, as previously outline, this 'uniqueness' would be better served. Also of significant value were the sometimes quite heartfelt disclosures of frustration, embarrassment and feelings of being misunderstood expressed by many of the respondents, and also in relation to conforming to institutional expectations, even pressure, to engage with support structures outwardly designed to ameliorate study difficulties and challenges - well-meaning as these are, but which actually increased were reported study burdens rather then reduce them, especially in relation to time management. For example:- "I did not use dyslexia support at all last year ... [I] find the extra time in having to organize dyslexia support well in advance is not helpful as I would much prefer to ask for help as and when I have a problem" [respondent #28, Dykes, 2008, p85]
- "I am unable to use study support sessions as I am already finding it hard to keep up with the course and don't have time" [respondent #34, ibid, p88]
- "Going for help with studies takes up more of my time when i'm already struggaling with too much work and not enough time and it rarely helps as I can't explain why I'm struggaling, otherwise I would have just done it in the first place ... [and] all the forms assosated with getting help or reimbursement for books etc means that I keep putting [it] off - forms are something I am daunted by" [respondent #20, ibid, p98]
Thus is has been that enquiry background that has fuelled this current study notably through three, lasting impression of this earlier small-scale enquiry which emerged. The first was that in this higher education context at least, it seemed that as many students with identified dyslexia appeared to be at ease with the challenges of their studies as were those who were burdened with them and struggled (Dykes, 2008). This was in part demonstrated by a clear distinction between students who appeared ambivalent towards the additional support provisions that they had won through their Disabled Students' Allowance, sometimes citing these as not really necessary and evidenced in part by a significant lack of interest in taking advantage of training opportunities for the assistive technologies that they had been provided with to make studying easier for them, and those who took quite the opposite standpoint. A similar result has been reported in another study where more than half of the 485 university students with dyslexia that were surveyed indicated that they had not taken up the assistive technology training that they had been offered although the reasons for this were not explored in detail with no distinction being made between training on hardware and training on software or assistive technology applications (Draffen et al, 2007). A later study amongst disabled students at the same institution (which coincidentally was also my own university both as a student and a member of staff) also uncovered a significant proportion of participants in the research cohort not taking up these training opportunities, citing time constraints, the burdensome nature of training regimes or the lack of contextual relevance to their studies as some of the reasons (Seale et al, 2010). Clearly this finding is a corroboration of the student comments reported above. A significant and possibly related factor may also be expressions of feelings of guilt about being given expensive hardware such as laptops and other devices that some dyslexic students felt they should not be entitled to because they did not consider themselves to be learning disabled and hence expressed unease this additional support that they did not feel that they really needed might be giving them an unfair advantage over their peers (Dykes, 2008).
The second feature that emerged from the earlier study which has impacted on the research methodology of this current project was evidence of a significant variability in attitudes towards their own dyslexia expressed by students in the earlier survey which appeared to be as much related to wide range of dyslexia 'symptoms' presented and students' perceptions of the relevance of these to their studies, as to other psychological factors such as self-esteem, academic self-efficacy and learned helplessness, collectively reflecting either a generally positive or negative approach towards the challenges of study at university - hence the interest in relating these factors to the degree of internal or external locus of control. The ways in which this has influenced the current research process has firstly been to flag up the complexity of the dyslexia syndrome and hence how challenges in clearly establishing what dyslexia means at university conflate many dyslexia research paradigms; and secondly how complex, psycho-educational factors that affect every individual's learning behaviours and attitudes to their studies can be teased out into identifiable variables or dimensions that can be somehow measured and thus are comparable across research subgroups.
The third factor that has influenced and strongly motivated this current project has been the significant proportion of student respondents in the earlier study who strongly expressed their feelings that their dyslexia was about much more than writing challenges and poor spelling, and also how being differentiated from other learners as a result of their dyslexia being identified to them had impacted negatively and had lasting effects.
- "Dyslexia is seen too much as a reading and writing disorder ... I am just not hard wired in [the same] way [as others]. I just end up feeling stupid 'cos I just don't get it" [respondent #12, Dykes, 2008, p95]
- "I find searching databases and getting started on writing especially difficult" [respondent #34, ibid, p88]
- "I avoid using computers at university as they are not set up the same as mine at home and I find it confusing" [respondent #19, ibid, p109]
- "My spelling and reading sometimes gets worse when I think about dyslexia. I get annoyed with the tact that people can blame bad spelling on dyslexia" [respondent #11, ibid, p82]
- "I am not sure dyslexia is real because I believe everyone, if given the chance to prove it, could be a bit dyslexic. So perhaps my problem is that I am not as intelligent as others, or that my lack of confidence from an early age decreased my mental capability" [respondent #9, ibid, p94]
- "In my academic studies I have always had good grades but never found it easy to concentrate on my work" [respondent #27, ibid, p100]
- "... I will be thinking of one word but write a completely different word, for example I will be thinking 'force' but write 'power' ... I'm obviously cross-wired somewhere" [respondent #33, p101]
- "When I do not understand, most people think the written word is the problem but [for me] it is the thought process that is different" [respondent #41, ibid, p128]
- "I was separated all the time [in primary school] and made out to be different. I feel this wasn't the best way to deal with me" [respondent #39, ibid, p103]
Hence taking the perspective that dyslexia can be a multifactoral learning difference that is much more than a manifestation of a reading and spelling disorder shaped by phonological deficits accumulated during early years has driven the desire to develop an alternative process for exploring such factors or dimensions in adult learners, thus forming the rationale for innovating the Dyslexia Index Profiler used in this project. - Defining dyslexia: the professional practitioners' view:
An outcome of the early stages of the literature review on dyslexia in this current project was an emerging unease about the lack of consensus amongst researchers, theorists and practitioners about how dyslexia should be defined. Having little recourse to a consensual definition about dyslexia was felt to be an obstacle in the research design, not least as it was clear that researchers and theorists tended to underpin their reports with exactly that: a definition of dyslexia. It was felt that to conduct a research study about dyslexia in the absence of a universally agreed definition of what it is could be problematic and it was recognized that others had expressed a similar disquiet, in some cases constructing alternative theories to resolve the issue of definition discrepancies (eg: Frith, 1999, 2002, Evans, 2003, Cooper, 2006, Armstrong, 2015). Some of these have been referred to above but in summary, what seemed to be emerging from the continued debate was that first of all, adherents to the deficit definitions which have traditionally been the preserve of clinicians who diagnose dyslexia have been numerous amongst earlier research and hence, this polarizes the research outcomes into alignment or not with this definition perspective. Secondly, the social constructivist model has encouraged the egress of 'differently-abled' as a definition standpoint which has gained in research popularity not least driven by inclusion agendas. Lastly, an increasing research narrative is supporting the argument that defining dyslexia is elusive to the extent that the label is unhelpful and laden with such stigma as to be academically counter-productive.
These issues have been discussed earlier however a practical outcome of this concern was an interest in exploring how dyslexia is framed in professional practice. The led to the development and subsequent deployment of a small-scale sub-enquiry, in fact more of a 'straw poll' given its limited methodological underpinnings, that aimed to construct a backdrop of contemporary viewpoints from amongst dyslexia support practitioners about how dyslexia is defined in their communities of practice. There are precedents for an enquiry that tries to explore professionals' knowledge about dyslexia. Bell et al (2011) conducted a comparative study amongst teachers and teaching assistants in England and in Ireland who had professional working contact with students with dyslexia to explore how teachers conceptualize dyslexia. The research asked teachers and teaching assistants to describe dyslexia as they understood it and the data collected was categorized according to Morton & Frith's causal modelling framework that defines dyslexia as either a behavioural condition, a cognitive one or of biological origin (Morton & Frith, 1995). Their paper highlighted concerns that the discrepancy model of dyslexia - that is, where the difficulties are assumed to be intrinsic to the learner - persisted amongst practitioners, where discrepancy criteria were more frequently used to identify learners with dyslexia rather any other category or criterion (ibid, p185). Significant in Bell's study was an acknowledgement of the wide-ranging spectrum of characteristics associated with dyslexia and learning and hence, the importance of developing highly individualized teacher-learner collaborations if students with learning differences are to be fairly accommodated in their learning environments. Emerging from this was the call for better teacher-training and development that enabled professional educators to gain a greater understanding of the theoretical frameworks and most up-to-date research surrounding dyslexia and how it can be both identified, formally or otherwise, and subsequently embraced in learning curricula. Soriano-Ferrer & Echegaray-Bengoa (2014) attempted to create and validate a scale to measure the knowledge and beliefs of university teachers in Spain about developmental dyslexia. Their study compiled 36 statements about dyslexia such as 'dyslexia is the result of a neurological disorder', 'dyslexic children often have emotional and social disabilities', 'people with dyslexia have below average intelligence' and 'all poor readers have dyslexia'. Respondents were asked to state whether they considered each statement about dyslexia to be true, false or that they did not know. Unfortunately their paper made no mention of the resulting distribution of beliefs, merely claiming strong internal consistency reliability for their scale. A similar, earlier (and somewhat more robust) study also sought to create a scale to measure beliefs about dyslexia with the aim of informing recommendations for better preparing educators for helping dyslexic students (Wadlington & Wadlington, 2005). The outcome was a 'Dyslexia Belief Index' which indicated that the larger proportion of research participants, who were all training to be or already were education professionals (n=250), held significant misconceptions about dyslexia. Similar later work by Washburn et al (2011) sought to gauge elementary school teachers' knowledge about dyslexia, using a criteria that claimed that 20% of the US population presents one or more characteristics of dyslexia. Other studies which also used definitions of dyslexia or lists of characteristics of dyslexia were interested in attitudes towards dyslexia rather than beliefs about what dyslexia is (eg: Honrstra et al, 2010, Tsovili, 2004).
Thus it was felt appropriate to echo Bell's (op cit) interest and attempt to determine the current viewpoint of professional practitioners at university by exploring their alliances with the some of the various definitions of dyslexia. 'Professional practitioners' are taken as academic guides, learning development tutors, dyslexia support tutors, study skills advisers and disability needs assessors but the enquiry was scoped broadly enough to include others who work across university communities or more widely with dyslexic learners. Given that the definition of dyslexia may be considered as 'work in progress' it is not unreasonable to suppose that an academic researcher may use one variant of the working definition of dyslexia in comparison to that applied by a disability needs assessor or a primary school teacher for instance. Hence it was felt that finding out the extent to which dyslexia is framed according to the domain of functioning of the practitioner would provide a useful, additional dimension to this project's attempt to understand what dyslexia is.
The enquiry was built around 10 definitions of dyslexia which were sourced to try to embrace a variety of perspectives on the syndrome. These were built into a short electronic questionnaire and deployed on this project's webpages (available here). The questionnaire listed the 10 definitions in a random order and respondents were requested to re-order them into a new list that reflected their view of them from the 'most' to 'least' appropriate in their contemporary context. The sources of the 10 definitions were not identified to the participants during completion of the questionnaire because it was felt that knowing who said what may introduce a bias to answers. For example, it was felt that a respondent may align their first choice with the definition attributed to the British Dyslexia Association (which was one of the sources) more out of professional/political correctness than according to their genuine view. Conversely, a respondent may dismiss the definition attributed to a TV documentary as inappropriate because this may be perceived as an unscientific or potentially biased source. On submission of the questionnaire the sources of all of the definitions were revealed and participants were told in the preamble to the questionnaire that this would occur. If was felt that curiosity about sources may be a contributory motivating factor to participate. Also provided in the questionnaire was a free-text area where respondents were able to provide their own definition of dyslexia if they chose to, or add any other comments or views about how dyslexia is defined. Additionally, participants were asked to declare the professional role and practitioner domain - for example 'my role is: 'a university lecturer in SpLD or a related field' '. The questionnaire was only available online and was constructed using features of the newly available HTML5 web-authoring protocols which enabled an innovative 'drag-drop-sort' feature. The core section that comprises the definitions and demonstrates the list-sorting functionality is below.
It was distributed across dyslexia forums, discussion lists and boards. and was also promoted to organizations with interest in dyslexia across the world, who were invited to support this straw poll enquiry by deploying it across their own forums or blogs or directly to their associations' member lists. Although only 26 replies were received, these did include a very broad cross-section of interests ranging from disability assessors in HE to an optometrist. Although a broad range of definitions was sought it is notable that 8 out of the 10 statements used imply deficit by grounding their definitions in 'difficulty/difficulties' or 'disorder', which is a reflection of the prior and prevailing reliance on this framework. With hindsight, a more balanced list of definitions should have been used, particularly including those pertinent to the latest research thinking which at the time of the questionnaire's construction had not been fully explored.
Outcomes:- The relatively positive definition #5, that of the British Dyslexia Association, which recognizes dyslexia as a blend of abilities and difficulties hence marking a balance between a pragmatic identification of the real challenges faced by dyslexic learners and a positive acknowledgement of many of the positive, creative and innovative characteristics frequently apparent in the dyslexic profile, was selected and placed in first, second or third place by 16 respondents with 12 of those placing it first or second. This only narrowly beat definition #8, noting dyslexia principally as a ‘processing difference’ (Reid, 2003) which was placed in first, second or third place by 14 respondents, also with 12 of those placing it in first or second place. Interestingly, this definition #8 beat the BDA’s definition for first place by 6 respondents to 5. The only other definition being selected and placed first by 6 respondents was definition #9 which characterizes dyslexia (quite negatively) with a ‘disability’ label, this being the only definition to include this in its wording indicating its origination in the USA where the term ‘learning disability’ is more freely used to describe dyslexia.
- Of the three results received from university lecturers in SpLD, two placed the BDA’s definition of a ‘combination of abilities and difficulties…’ in first position with the third respondent choosing just the definition describing dyslexia as a specific learning disability.
- 7 respondents described their professional roles as either disability/dyslexia advisors or assessors by which it is assumed these are generally non-teaching/tutoring roles although one respondent indicated a dual role in being a primary teacher as well as an assessor. None of these respondents used the BDA’s definition as their first choice, with two not selecting it at all. Of the remaining five, this definition was either their second or third choice. Two of these respondents put definition #8, ‘a processing difference…’ in first place with three others choosing definition 9, ‘a specific learning disability’ to head their list. Perhaps this is as we might expect from professionals who are trying to establish whether an individual is dyslexic or not because they have to make this judgment based on ‘indications’ derived from screenings and tests which are comprised of intellectual and processing challenges particularly designed to cause difficulty for the dyslexic thinker. This is central to their identifying processes. Although the professionalism and good intentions of assessors and advisors is beyond doubt, it might be observed that there is perhaps a 'culture of diagnosis’ which predominantly marks the dyslexia identification process and that this may generate an unintended but nevertheless somewhat dispassionate and detached familiarity with the association of 'diagnosis' with clinical evaluations of something wrong, and hence be not fully appreciative of the impact that learning about their dyslexia might have on an individual who, most likely given a learning history peppered with frustration, difficulties and challenges, has now experienced an ‘assessment’ that, in the interests of ‘diagnosis’, has, yet again, spotlighted those difficulties and challenges. To be fair, some studies have reported that some individuals who find out about their dyslexia have been recorded as remarking that is was a liberating process rather than a negative one (eg: Riddick 2000, Morgan & Klein, 2000, Kong, 2012).
- One respondent was an optometrist ‘with a special interest in dyslexia’ who selected just one definition in their list, this being #9, ‘a specific learning disability…’ but additionally provided a very interesting and lengthy commentary which advocated visual differences as the most significant cause of literacy difficulties. An extensive, self-researched argument was presented, based on an exploration of ‘visual persistence’ and ‘visual refresh rates’. The claimed results showed that ‘people who are good at systems thinking and are systems aware are slow, inaccurate readers but are good at tracking 3D movement, and vice versa’, adding that ‘neurological wiring that creates good systems awareness [is linked with] slow visual refresh rates and that this results in buffer overwrite problems which can disrupt the sequence of perceived letters and that can result in confusion in building letter to sound associations’. This respondent was also of the opinion that none of the definitions offered were adequate (actual words used not repeatable here) with some particularly inadequate, commenting further that ‘I do not know what it would mean to prioritize a set of wrong definitions’ - a point which distils much of the argument presented in my thesis so far relating to issues of definition impacting on research agendas.
So from this relatively cursory inspection of the key aspects of respondents’ listings overall, it seems fairly evident that a clear majority of respondents align their views about the nature of dyslexia with both the that of the British Dyslexia Association and with that of an experienced practitioner, researcher and writer Gavin Reid, (2003), whose work is frequently cited and is known to guide much teaching and training of dyslexia ‘support’ professionals. With the exception of Cooper’s description of dyslexia being an example of neuro-diversity rather than a disability, difficulty or even difference, definitions used by researchers and even professional associations by and large remain fixed on the issues, challenges and difficulties that dyslexia presents when engaging with the learning that is delivered through conventional curriculum processes. This approach compounds, or certainly tacitly compounds the ‘adjustment’ agenda which is focused on the learner rather than the learning environment. Although it is acknowledged that more forward-looking learning providers are at least attempting to be inclusive by encouraging existing learning resources and materials to be presented in more ‘accessible’ ways – at least a pragmatic approach – this remains some distance away from adopting the principles of Universal Design for Learning and operationalizing them in university teaching contexts. - Existing dyslexia evaluators and identification processes in higher education - why these were dismissed:
The majority of current devices used in higher education settings for identifying dyslexia in students search diagnostically for deficits in specific, cognitive capabilities and use baseline norms as comparators. These are predominantly grounded in lexical competencies. As long as the literacy-based hegemony prevails as the defining discourse in judgments of academic abilities (Collinson & Penketh, 2010) there remains only a perfunctory interest in devising alternative forms of appraisal that might take a more wide-ranging approach to the gauging of academic competencies and especially how these may be impacted by learning differences. All of the tools use a range of assessments which are built on the assumption that dyslexia is principally a phonological processing deficit that is accompanied by other impairments in cognitive functioning which collectively, are said to disable learning processes to a sufficient extent that the 'diagnosed' individual is left at a substantial disadvantage in relation to their intellectually-comparable peers. The principle reason for identifying a student as dyslexic in university settings - well-meaning as this is - has been to evidence entitlement to learning support funding through the Disabled Students' Allowance (DSA) within which dyslexia has been regarded as a disability. In the light of persistent funding constraints, a UK Government review of the provision of the DSA, first published in 2014, originally proposed the removal of dyslexia, termed Specific Learning Difficulties, from the list of eligible impairments, mental health conditions and learning difficulties, but to date the proposals set out in the review have not been actioned, not least as a result of strong lobbying from organizations such as the British Dyslexia Association, PATOSS (the Professional Association for Teachers and Assessors of Students with Specific Learning Difficulties) and ADSHE (the Association of Dyslexia Specialists in Higher Education). Although undergoing a less intrusive screening process is usually the first stage in attempting to establish whether a student presents dyslexia or not, full assessments can only be conducted by educational psychologists and although the battery of tests and assessments administered might be considered as necessarily comprehensive and wide-ranging, due in no small part to the requirement to ensure that any support funding stream allocated results from an accountable process, undergoing such cognitive scrutiny is time-consuming, fatiguing for the student being 'diagnosed' and can add to feelings of difference (Cameron, 2015), anxiety (eg: Carroll & Iles, 2006, Stampoltzis, 2017) and negative self-worth (Tanner, 2009) typically experienced by learners who may already be trying to understand why they find academic study so challenging in comparison to many of their peers.
A lengthier discussion about dyslexia assessments and identification has been presented above and aside from an unease about these in the light of the more multidimensional conceptual understanding of dyslexia, an additional reason for not using existing metrics for discriminating dyslexia-ness in this project is due to the ethical issues that would be raised about disclosure to declared non-dyslexic students whose outcomes on such assessments, even within the framework of this project's questionnaire, nevertheless might appear to indicate dyslexia. This project is interested in measuring levels of dyslexia-ness rather than to identifying dyslexia as it is central to the methodological processes used in this project that a metric is devised that focuses on study attributes and learning preferences rather than the cognitive characteristics conventionally regarded as deficit indicators in individuals with dyslexia. This is also consistent with the approach focus for the Academic Behavioural Confidence Scale, the partner metric in this study, as the ABC Scale is devised to gauge academic confidence in terms of study actions, plans and behaviours that impact on academic study and is not concerned with cognitive factors. It is of note that there is a small but growing recognition in university learning development services and study skills centres, at least anecdotally, that finding alternative mechanisms for identifying study needs, whether these are appear to be dyslexia-related or not, is desirable, especially in the climate of widening participation currently being promoted in our universities. Although these have been driven through a need for finding improved and positively-oriented mechanisms for identifying learning differences typically observable in dyslexic students (Casale, 2015, Chanock et al, 2010, Singleton & Horne, 2009, Haslum & Kiziewicz, 2001) what appears to emerge out of the discussion of studies' results is that many of the characteristics that are being evaluated may prove more broadly useful as identification discriminators in the realm of study skills and academic learning management across complete university communities of learners. In other words, finding other ways to describe dyslexia multidimensionally as opposed to discretely identifying or diagnosing it is gaining traction and there is evidence that this is being achieved through the use of non-cognitive parameters, notably supported by evidence provided through discursive constructions of dyslexia using the everyday lived experiences of dyslexic students at university (Tanner, 2009, Cameron & Billington, 2015a, Cameron & Billington, 2015b, Cameron, 2016, Mac Cullagh et al, 2016) and amongst adults with dyslexia more widely (Nalavany et al, 2011, Thompson et al, 2015).
However not least as a means to aid the development of an expedient data-collection tool, it has been useful to review current electronic, that is, web-browser or computerized dyslexia screeners. Aside from tools such as the DAST and LADS software applications reviewed above in sub-section ##, others have attempted to create electronic, computerized screeners since the advent of desktop computer facilities becoming more widely available in recent decades. Worthy or mention is the QuickScan + StudyScan Suite which attempted to produce an innovative and comprehensive assessment that tried to draw on opportunities that appeared to be presented by emerging computer technologies. This assessment tool was launched in the late 1990s as a collaborative venture between the Universities of Ulster and Leicester and a commercial educational service provider (Pico Ltd) as a result of a small research study (Zdzienski, 1998). The screener was developed out of data collected from a substantial sample of 2000 university students taken from two HE institutions in the UK of which 200 were known to be dyslexic. Mention of it is included in this thesis because the design rationale shares similarities with the approach adopted here for the Dyslexia Index Profiler in this project whereby the aim of the screener was to produce a much wider profile of skills, attributes and characteristics through a blend of assessments that took study processes, perceived strengths and weaknesses and learning style preferences as the principal foci of its self-report questionnaire. These included a range of other characteristics and attributes that are indicators of a dyslexia with these being drawn from Vinegrad's Adult Dyslexia Checklist (1994) which has also been informative in the development of the Dyslexia Index Profiler in this project. As such, the QuickScan screener sets an early precedent for an evaluator that attempts to gauge dyslexia-ness as a potentially impacting element within a wider academic learning management profile, many of the aspects of which might be equally applicable to students with no indications of a conventionally-definied dyslexia, much as the data analysis outcomes of this thesis have also revealed. The process required the screening tool, QuickScan, to be used first where 112 self-report questions ranged from statements gauging working memory, competencies in systematic memory recall, time-management and organization, perceived competencies in reading and spelling, right- left-handedness, other questions which were dubiously aligned with the vision-differences theories of dyslexia such as 'do you find that your eyes tend to get tired when reading?' and and a range of other outwardly incongruous questions such as 'do you tend to hum or talk to yourself?' or 'if you get angry do you often shout?' or 'when visiting somewhere for the firt time, is it the atmosphere and the feel of the place that makes the greatest impression on you?'. Respondents were required to provide only a binary yes or no response. No Likert-style anchor point gradations were provided to enable other response selections such as 'sometimes' or 'infrequently' to be offered. The screener remains available as a desktop application and so it was reviewed. Questions are presented in a small, on-screen text box where colour combinations between text and background are selectable from a modest choice, as is font size, echoing the popularity at the time for providing accessibility tools to make the reading of on-screen text less visually stressful, although the relationship between dyslexia and visual stress had remained contentious (Singleton & Trotter, 2005). No provision is made for audio presentation of questions for example by using a text-to-speech engine although this may be because text-to-speech applications such as TextHelp Read & Write and ClaroRead were at an early stage of development and not readily available at the time. It is claimed that 15 minutes is sufficient to complete the test but on working through the screener twice with an interval of at least 6 months between the two attempts, both took longer than 20 minutes. The questions were answered quickly without hesitations for 'thinking time'; I have no known dyslexic learning differences and would imagine that my academic experience may have fostered a better-than-average text-scanning capability together with a familiarity with the content and context of the questions in the assessment. So it is doubtful that a student with little or no experience of such assessments would complete it in the suggested 15 minutes. The output provided at the end of the test is a cursory, summary evaluation of learning styles (mine came out as 'multisensory' both times) with some broad guidance and advice about how to make best use of that information. Also presented were indications about whether or not a need for supplementary study support had been indicated and whether specific learning difficulties consistent with dyslexia were revealed - it suggested neither for me. If the QuickScan screener reports otherwise, the intended pathway is for the StudyScan diagnostic tool to be applied. This was a much more comprehensive diagnostic process based on the American SATA assessment (Scholastic Abilities Test for Adults (Bryant et al, 1991)) comprising in total, 17 distinct assessments ranging from non- and verbal-reasoning tests to other assessments for memory, phonological competencies, visual processing, reading and writing speeds, punctuation, numerical calculations and eight others. It was expected that the complete assessment procedure would be likely to take between two and four hours which, by any reasonable judgment, would surely have made it a demanding and onerous task, especially so for the very students it was attempting to identify.
An extensive critique of the QuickScan + StudyScan Suite was conducted in a three-university collaborative project (Haslam & Kiziewicz, 2001) at the Universitites of Bath, Bristol and West of England with data collected principally from a sample of students who undertook the complete assessment process (n=126). This data was collected at just one of those universities (Bath) because that location had a well-developed Learning Support Service and access to data from a greater number of students with dyslexia. Haslam & Kiziewicz made a number of astute conclusions about the viability of the Suite, particularly noting logistical challenges in administering a two-stage computerized test not least due to technical issues with the hardware and software used to present them but also due to the amount of time required to complete the tests reporting that 'some students returned several times to complete the assessment' (ibid, p15). This highlighted the further difficulty of respondent attrition where many students who screened as likely to be strongly dyslexic in the first-stage screener failed to complete, or even to attend the second stage multi-test StudyScan profiler. One interesting feature did emerge out of the classification table of correlations between the outcomes of the QuickScan screener and the subsequent outcomes of the StudyScan assessment being that exactly half of the students who were shown by the QuickScan screener as presenting 'some of the indicators' of dyslexia and who went on to take the full StudyScan assessment were subsequently shown to have profiles which were either 'not consistent with dyslexia' or 'borderline' or presented an 'inconclusive indicator'. Although this outcome would make it difficult for a university learning development or support service to make a sound judgement about whether such students were dyslexic or not as they appear to be presenting some but not all of the 'indicators' of dyslexia, a similar outcome has been observed in my study where a not insubstantial proportion of both students who declared no learning challenges and students who declared their dyslexia presented a Dyslexia Index value that also put them in an apparently 'borderline' area. There may be many explanations for this, especially as both the survey conducted by Haslam & Kiziewicz and my own project gained data from relatively small although respectable sample sizes (n=126 and n=166 respectively) which is a limitation on the generalizability of the outcomes. But given both studies appear to have revealed a significant number of students who might be regarded as partly dyslexic, or just dyslexic sometimes or in particular circumstances, the idea cannot be ignored that this is evidence of the significant difficulties that remain very challenging to address when designing new processes for determining whether a student presenting a particular set of study or academic learning management difficulties is actually presenting dyslexia or not. This is the point made by Elliott & Grigorenko (2014) who conclude that if a workable assessment tool is to be devised and developed, then the primary issue is establishing sensible boundary conditions above and below which dyslexia is considered to be the 'cause' of the student's difficulties or not. This is, of course, not least due to a) the persistent difficulty in defining dyslexia in the first place and b) the wide diversity of learning differences that may be presented. Further doubts about the viability of the QuickScan + StudyScan Suite were identified by Sanderson (2000) whose highly critical report on unspecified 'pilot studies' of the Suite identified serious flaws in both the assessment's validity and lack of evidence of reliability. Accepting that ensuring a test for dyslexia is valid raises a multitude of issues, once again not least due to the wide variety of attributes and characteristics present or absent in a bewildering array of combinations but widely regarded as possible indicators of dyslexia, Sanderson also highlighted concerns over the Suite's use of the concepts of preferred learning styles as one of the data-outcome quantifiers. Principally the criticism was that adopting the idea that preferred learning styles are fixed is dubious, citing evidence from other researchers (ibid, p286: Miles, 1991, Thomson, 1999) to highlight not only the complexity and possible fluidity of an individual's learning style but also how this may be influenced by pedagogical styles experiences. Mortimore (2005) also indicated the need for a cautious approach to using learning styles evaluations based on limited data sources, especially when these are intended to discretely classify learners and dependently apply teaching approaches, not only in respect of working with dyslexic learners but also more widely. Sanderson (op cit) concluded that the publication of the QuickScan + StudyScan Suite was premature and that more work needed to be undertaken at a fundamental level before the Suite could be used with confidence as a dyslexia identifier.
However this does not alter the fact that building profiles of learners that through careful interpretation might provide insights into the ways in which they function in learning domains can be useful provided the outcomes of the profilers are not used too deterministically. Dyslexia is clearly not a black-and-white construct and mounting evidence supports the view that categorizing students, in higher education in particular, as dyslexic or as not dyslexic is unhelpful, possibly stigmatizing - perhaps especially so when dyslexia is diagnosed as a disability, and is also possibly positively discriminatory where legislation that seeks to redress apparent disadvantage might in fact, bestow non-equitable academic advantage as an outcome, not least through the application of 'reasonable adjustments' which may threaten academic standards (Riddell & Weedon, 2007). But gaining knowledge of a dyslexia, however it may be defined, is liberating for some adult learners (as mentioned earlier in sub-section ##) because this might at last enable them to understand why they may have found learning so challenging in the past. Navigating a path through this landscape has been one of the greatest challenges of this research project and hence, has contributed to the rationale for designing and building the specific, evaluative tool to meet the needs of this study's research questions. By adopting an approach to devising a metric that considers variances in study behaviours and learning preferences as the basis of its working parameters, the Dyslexia Index Profiler that has been developed is building on the emerging discourse that is grounded in non-cognitive evaluative processes. A detailed account of this design and development is presented below, but in summary and given the boundary conditions that were established, the Dyslexia Index Profiler correctly identified as dyslexic, or not likely to be not dyslexic, all but 2 of the 68 students in the research subgroup who disclosed in the questionnaire that they had been formally identified with dyslexia. This can be consigered as a 'positive' when it comes to justifying the development of a fresh evaluative metric that is fit for purpose in this project.
- Rationale for developing the Dyslexia Index (Dx) Profiler:
The Dyslexia Index (Dx) Profiler has been developed to meet the following design specifications:
- it is a self-report tool requiring no administrative supervision;
- it includes a balance of literacy-related and wider, academic learning-management evaluators;
- it includes elements of learning biography;
- self-report stem item statements are as applicable to non-dyslexic as to dyslexic students;
- although Likert-style based, stem item statements are to avoid fixed anchor points by presenting respondent selectors as a continuous range option;
- stem item statements are written so as to minimize response distortions potentially induced by negative affectivity bias (Brief, et al, 1988);
- stem item statements are written to minimize respondent auto-acquiescence ('yea-saying') which is the tendency to respond positively to attitude statements and has been identified as often problematic (Paulhaus, 1991), supported by the response indicator design requiring a fine gradation of level-judgment to be made;
- although not specifically designed into the suite of stem-item statements at the outset which are presented in a random order, likely natural groupings of statements are expected to emerge through factor analysis as sub-scales.
- stem item statements must demonstrate a fair attempt to avoid social desirability bias, that is, the tendency of respondents to self-report themselves positively, either deliberately or unconsciously. In particular, an overall neutrality should be establisted for the complete Dx Profiler so that it would be difficult for participants to guess what are likely to be responses that would present them in a favourable light (Furnham & Henderson, 1982).
It has been constructed following review of dyslexia self-identifying evaluators, in particular, the BDA's Adult Checklist developed by Smythe and Everatt (2001), the original Adult Dyslexia Checklist proposed by Vinegrad (1994) upon which many subsequent checklists appear to be based, and the much later, York Adult Assessment (Warmington et al, 2012) which has a specific focus as a screening tool for dyslexia in adults and which, despite the limitations outlined above in sub-section ##, was found to be usefully informative. Also consulted and adapted has been work by Burden, particularly the 'Myself as a Learner Scale' (Burden, 2000), the useful comparison of referral items used in screening tests which formed part of a wider research review of dyslexia by Rice & Brooks (2004) and more recent work by Tamboer & Vorst (2015) where both their own self-report inventory of dyslexia for students at university and their useful overview of other previous studies were consulted.
It is widely reported that students at university, by virtue of being sufficiently academically able to progress their studies into higher education, have frequently moved beyond many of the early literacy difficulties that may have been associated with their dyslexic learning differences and perform competently in many aspects of university learning (Henderson, 2015). However the nature of study at university requires students to quickly develop their generic skills in independent self-regulated learning and individual study capabilities, and enhance and adapt their abilities to engage with, and deal resourcefully with learning challenges generally not encountered in their earlier learning histories (Tariq & Cochrane, 2003). Difficulties with many of these learning characteristics or 'dimensions' that may be broadly irrelevant or go un-noticed in children may only surface when these learners make the transition into the university learning environment because adult learning in higher education requires greater reliance on self-regulated learning behaviours in comparison to earlier, compulsory education contexts where learning is largely teacher-directed. Many students struggle to deal with these new and challenging learning regimes (eg: Leathwood & O'Connell, 2003, Reay et al, 2010), whether dyslexic or not and not least as an outcome of successful initiatives in widening participation in higher education which in the UK at least, have also brought substantial increases in attrition rates amongst the very students from 'non-traditional' backgrounds that have been successfully recruited (Crozier et al, 2008). This has seen many, if not most universities develop generic study-skills and/or learning development facilities and resources to support all students in the transition from regulated to self-regulated learning with evidence for this being widespread, ranging from reports on the successes of more general social capital interventions (Schwartz et al, 2018) to initiatives that are more keenly focused, for example on targeted discipline specific areas such as enhancing maths and numeracy skills amongst engineering students (Choudhary & Malthaus, 2017). It is possible that increasing institutional awareness of their duties to respond to quality assurance protocols and recently introduced measures of student satisfaction such as the TEF (Teaching Excellence Framework) has also influenced the development of academic skills provisions in universities, together with a commercial interest in keeping levels of attrition to a minimum both to reduce the financial consequences of loss of student-fees income and also to minimize the publicity impact that attrition levels might have on future student recruitment.
For many students, gaining an understanding about why they may be finding university increasingly difficult, perhaps more so than their friends and peers, does not happen until their second or third year of study when they subsequently learn of their dyslexia, most usually through referral from diligent academic staff to learning support services (eg: Doherty, 2015). It might be argued that until more recently, these students have been the 'fortunate few' leaving others with no formally identifiable learning, or academic learning management challenges potentially unsupported in many circumstances. One earlier research paper established that more than 40% of students with dyslexia only have their dyslexia identified during their time at university (Singleton et al, 1999). Given acknowledgement that widening participation and alternative access arrangements for entry to university in the UK has certainly increased the number of students from under-represented groups moving into university learning (Mortimore, 2013) and although given the increased levels of participation in higher education generally it is the proportion of students with dyslexia relative to the student population as a whole rather than the absolute number that might be a better indicator, it is nevertheless possible that the Singleton et al (op cit) estimate remains reasonable. This might further suggest that many dyslexic students progress to the end of their courses remaining in ignorance of their learning differences, and indeed it is likely that many will have gained a rewarding academic outcome. This is suggesting that their dyslexia, such that it may be, has been irrelevant to their academic competency and has had little impact on their academic agency and achievement.
But there are many reasons why dyslexia is not identified at university and a discussion about this is presented above (sub-section ##). However one explanation for this late, or non-identification may be because these more, academic learning management-type dimensions of dyslexia which are components of self-regulated learning processes are likely to have had little impact on earlier academic progress because school-aged learners are supervised and directed more closely in their learning at those stages through regulated teaching practices. At university however, the majority of learning is self-directed, with successful academic outcomes relying more heavily on the development of effective organizational and time-management skills which may not have been required in earlier learning (Jacklin et al, 2007). Hence, because the majority of the existing dyslexia-identifying metrics appear to be weak in gauging many of the study skills and academic competencies, strengths and weaknesses of students with dyslexia that may either co-exist with persistent literacy-based deficits or have otherwise displaced them, this raised a concern about using any of these metrics per se. This is a concern shared by many educators working face-to-face with university students where there has been a recent surge in calls for alternative assessments which more comprehensively gauge a wider range of study attributes, preferences and characteristics (eg: Chanock et al, 2010, Casale, 2013).
Thus two preliminary enquiries were developed that sought to find out more about how practitioners are supporting and working with students with dyslexia in UK universities. The aim was to guide the development of the Dyslexia Index Profiler by grounding it in the practical experiences of supporting students with dyslexia in university contexts because it was felt that this would complement the theoretical basis of the metric. The first enquiry (reported directly above (2)) aimed to find out more about the kind of working definition of dyslexia that these practitioners were adopting; the second aimed to explore the prevalence of attributes and characteristics associated with dyslexia that were typically encountered by these practitioners in their direct interactions with dyslexic students at university on a day-to-day basis. The results of this second enquiry have been instrumental for building the Dyslexia Index Profiler and are reported fully in Appendix 7.2.
The Profiler has collected quantitative data from participant responses across the complete datapool which has enabled baselines scores of dyslexia-ness to be established for students who have disclosed their dyslexia, thus establishing the control group for the study. As a consequence of this process, scores from participants who declared no dyslexic learning differences could be compared and from these, two distinct subgroups established: firstly, a subgroup of non-dyslexic student participants whose scores are so far adrift from those in the dyslexic control group that these could be properly considered as non-dyslexic, that is, who presented a low level of dyslexia-ness; secondly, a subgroup of apparently non-dyslexic student participants whose scores are similar to those in the control group, hence establishing the subgroup of very particular interest to the study, which is students who had declared themselves to be not dyslexic but who nevertheless presented a similar level of dyslexia-ness to those students in the dyslexic control group. This study defines this as quasi-dyslexia. Thus, the academic confidence of the three subgroups could then be compared.
The final iteration of the Dyslexia Index Profiler comprised 20 Likert-style item statements and each item statement aimed to capture data about a specific study attribute or aspect of learning biography. At the design stage, item statements were referred to as 'dimensions' and were loosely grouped into scales each designed to measure distinct study and learning management processes. At the outset, these were determined 'by eye' into 5 categories or scales: Reading; Scoping, Thinking and Research; Organization and Time-management; Communicating Knowledge and Expressing Ideas; Memory and Information Processing. With results available to inspect after deployment of the Dx Profiler, factor analysis applied dimensionality reduction to re-determine these scales and new dimension groupings emerged, subsequently referred to as FACTORS and designated:- Factor 1: Reading, writing and spelling;
- Factor 2: Thinking and processing;
- Factor 3: Organization and time-management;
- Factor 4: Verbalizing and scoping;
- Factor 5: Working memory;
- Gauging academic confidence by using the Academic Behavioural Confidence (ABC) Scale:
The ABC Scale developed by Sander & Sanders throughout the first decade of this century has generated a small but focused following amongst researchers who are interested in exploring differences in university student study behaviours and academic learning management approaches. A thorough review of the research outputs generated from both Sander, and Sander & Sanders original studies is provided in the Theoretical Perspectives section of this thesis.. However it is pertinent to provide a brief summary overview of the position of the Academic Behavioural Confidence scale in this project as part of this section.
There appear to be no peer-reviewed publications which explicitly explore the impact of dyslexia on academic confidence as defined through the rationales which underpin the Academic Behavioural Confidence Scale - that is, in relation to self-regulated learning, typified by academic learning management skills presented by study behaviours of students at university. The only previous studies found have been two undergraduate dissertations. Of these, Barrett's (2005) study is not available to consult due to access restrictions at the home university and on the basis of it's title, 'Dyslexia and confidence in university students', it is not known whether academic confidence had been the focus of the research. We can only know more through the Sanders et al (2009) reference to this dissertation in their paper which looked at gender differences in the academic confidence of university undergraduates which cites Barrett's study as providing evidence that dyslexia impacts on academic confidence. However Asquith's (2008) project is available to consult. That study used the ABC Scale to compare levels of academic confidence between dyslexic students at university who were in receipt of learning support against students not receiving support, both dyslexic and non-dyslexic. The study also explored levels of self-esteem and the intention was to show that students with dyslexia present lower levels of both academic confidence and self-esteem than their non-dyslexic peers, but that dyslexic students receiving learning support had elevated levels of both academic confidence and self-esteem in comparison to dyslexic peers who were not receiving support. The 24-item ABC Scale was used to measure academic confidence, Vinegrad's Adult Dyslexia Checklist gauged students' liklihood of presenting dyslexia and students' self-esteem was evaluated through the well-established and widely used Rosenburg Self-Esteem Scale. Data collected from the moderately-sized sample (n=128) was analysed using robust, statistical processes with the results indicating some significant differences in academic confidence and self-esteem between the three research subgroups. What is not clear is how Asquith dealt with the ethical issues of using a widely available, proprietary screener for dyslexia as the means to identify students with dyslexia who were not taking up learning support, hence assuming that these students were unidentified dyslexics. There is no mention about whether these participants were later informed that the dyslexia screener had identified the strong likelihood that they may be dyslexic.
Hence with no other studies found, it is assumed that this current project has found a gap in the research for two main reasons: firstly, this project has avoided ethical difficulties around covertly screening for dyslexia through use of an existing and clearly attributable dyslexia screening tool by specifically developing a profiling instrument which draws on differences in academic learning management attributes as the discriminator, and hence by defining the outcome of the profiler as indicating a level of dyslexia-ness, has been able to identify students who may be presenting apparent dyslexia but who are otherwise not formally identified as dyslexic; and secondly, by demonstrating much of the research evidence supporting indications that academic confidence impacts on academic achievement and by operationalizing academic confidence through academic behavioural confidence, which is also rooted in academic learning management processes, namely study behaviours, has been able to design a research methodology and develop research methods which will show that students with levels of dyslexia-ness that are in line with formally identified dyslexic students present higher levels of academic confidence, measured through the Academic Behavioural Confidence Scale, than their formally identified peers. Hence from this, it can be suggested that formally identifying dyslexia in students at university may not be as beneficial as previously assumed especially since the typical learning development opportunities most usually afforded to dyslexic students are becoming more widely available to all students in university communities.
The Academic Behavioural Confidence Scale is therefore a highly appropriate evaluator to attribute as the dependent variable in this study.
All of these considerations were welded into a research design for this current project which proposed at the outset to firstly develop the profile visualizations of the prior study into a discriminator for identifying dyslexia-like characteristics amongst apparently non-dyslexic students, and secondly to adopt Sanders et al (2003, 2006) established Academic Behavioural Confidence Scale as a mechanism for exploring the differences in academic confidence between students with dyslexia, students with no dyslexia and most importantly, students with previously unidentified dyslexia-like profiles. As reported elsewhere in this thesis, the ABC Scale has been used in a number of recent research studies to investigate the causes for differences in students' study behaviours but to date, this process is not known to have been applied specifically to explore the impact of dyslexia on academic confidence. The decision to make use of the ABC Scale emerged out of reflecting on the resonance that the construct of 'academic confidence' had with the differences observed in the earlier study between dyslexic students who expressed a general confidence in tackling their studies at university compared with those others who presented low levels of self-esteem and academic self-efficacy which correlated negatively with levels of study anxiety, defeatism, learned helplessness and, to a lesser extent, academic procrastination. This led to the supposition that this disparity may be a function of how individuals' were incorporting their dyslexic identity into their study identify, with those who were more comfortable with their dyslexic self being part of who they are presenting more positive approaches towards their studies than others who strongly perceived their dyslexia as a disabling characteristic of their study identity and to which they tended to attribute their low levels of self-esteem and self-confidence in tackling academic challenges. Much of this earlier thinking has been grounded in Burden's extensive research with dyslexic adolescents which collectively was one of the few research interests that took individuals' feelings and attitudes to their dyslexia as the main focus - that is, the affective dimension of dyslexia (Burden, 2008a, Burden, 2008b, Burden & Burdett, 2005, Burden & Burdett, 2007). The Myself-As-A-Learner Scale (MALS) (Burden, 2000), developed out of his research into dyslexic teenagers' approaches to their learning which in particular looked at attitudinal differences within learners attending a special school which specifically focused on supporting dyslexia, was designed to evaluate students' academic self-concept as a means to understand more about how learners' self-identity impacted on academic engagement and ultimately, attainment. Key to this, has been the broad use of confidence as a characterizing attribute. The scale has been used in a number of more recent studies amongst learners where dyslexia was not the focus of the enquiries nor was the condition mentioned but these studies were ones which recognize that academic self-concept and the affective dimensions that accompany it has traditionally been regarded amongst researchers to have less significance in relation to academic attainment than the concept of intelligence. Amongst these has been a longitudinal study which was interested in changes in students MALS scores as they progressed through secondary education (Norgate et al, 2013), a project which was exploring the relationships between academic self-concept, classroom test performance and causal attribution for achievement (Erten & Burden, 2014) and an interesting study which looked at how socio-emotional characteristics of dyslexic children were modified during their temporary extraction from mainstream teaching settings into specialist learning units to support enhancing literacy skills (Casserly, 2012). Burden took the MALS as a starting point for further development with many of the conceptual underpinnings surfacing in a much more focused metric, the Dyslexia Identity Scale, (Burden, 2005a). This evaluator was concerned with finding out more about the affective dimensions of dyslexia and how these contributed to a dyslexic learner's sense of 'self'. Other researchers were similarly interested in the 'dyslexic self', notably Pollack (2005) whose interest was more with dyslexia in higher education contexts and how institutional perceptions and understandings about dyslexia should be challenged in the light of agendas promoting greater inclusivity and accessibility, suggesting that a reframing of teaching and learning approaches to be more properly aligned with this social justice agenda were long overdue, resonating once again with the Universal Design for Learning agenda.
Reflecting on the research methodology that supported the enquiry at that time, hindsight suggests that it would have benefitted from a more robustly developed framework based on theoretical underpinnings that could have been better understood at the time although the high final grade for the dissertation indicated that it had nevertheless presented an understanding of the relevant concepts and application of theory to method that was broadly appropriate for that level of study, and had produced a primary research output that enabled some acute obervations to be made about the functioning of dyslexic students at university.
![]()
However it was also clear that significant variability was present in practitioners’ alignment with a definition of dyslexia which appeared to be indicating an inconsistency in adoption of a consensual understanding about how the syndrome may be best defined. Ryder & Norwich (2018) were also concerned about anecdotal evidence of archaic or inconsistent application of the dyslexia label that had been observed in this field of dyslexia identification throughout the higher education sector in the UK. From a sample of n=118 dyslexia assessors and support teachers at UK universities their findings confirmed a significant lack of consistency in the interpretation of literacy difficulties amongst students being assessed for dyslexia, a widespread commitment to controversial or outdated discrepancy definitions and concepts and a broad preference to rely on professional experience in the face of scepticism about the value of the outputs of psychometric testing. The key recommendation of the Ryder & Norwich study has been that ‘assessors would do well to differentiate assessment for intervention from assessment for statutory disability entitlement’ (ibid, p124) not least because dyslexia is not a discrete concept but a multidimensional one. Hence the small-scale straw poll conducted as part of this current study, reported above and more fully in Appendix 7.1, appears to have been validated.
![]()
![]()
![]()
![]()
Collecting information - the rationales, justifications and challenges
This project is focused on the finding out more about the academic confidence of university students and is relating this to levels of dyslexia-ness, a new descriptor that draws on a combination of conventional indicators of dyslexia such as perceived and historical levels of competency in literacy-based skills, together with other traits commonly observed in students with dyslexia at university that are said to impact on the effectiveness of their academic learning management and study routines. This is a primary research project so research participants have had to be located and information from them requested.
The data collection objectives were thus:
- To design and build a data collection instrument that could expediently and unobtrusively request real-world information about academic confidence and aspects of dyslexia-ness in information formats that could easily be collated and statistically analysed once acquired, from a range of research participants drawn from a university community of students;
- To pay careful attention to ensuring that the data collection instrument was as clear, accessible and easy-to-use as possible noting that participants with dyslexia were to be a significant proportion of respondents;
- To ensure that the data collection instrument was able to acquire information quickly by designing questions that were as short and clearly presented as possible, in an innovative format that aimed to maintain research participant interest and attention throughout;
- The data collection should be a process that is as brief as possible for the participant, and that the complete data collection aspect of the project should be easily completed within a reasonable time-frame. 15 minutes was considered as the target;
- The complete process was compliant with all ethical and other research protocols and conventions for data collection according to guidelines and regulations specified by the researcher's home university;
- The data collection instrument could be administered remotely through an electronic means and that participants could engage with it at their convenience;
- Participants should feel part of a research project rather than its subjects, and hence would be more likely to be sufficiently interested in its focus and relevance to their own university study experiences to engage with it and provide honest responses;
- As far as possible, these data collection techniques were to be designed to try to maximize response rates and minimize selection bias for the target audience;
Academic confidence has been operationalized using a standardized and freely available metric, the Academic Behavioural Confidence Scale which is a 24-item self-report questionnaire. Participants' dyslexia-ness would also be gauged using a self-report process using a fresh approach developed especially for this study - the Dyslexia Index Profiler. Other relevant demographics would be collected simultaneously and voluntarily-provided, supporting qualitative data would also be acquired through an open-ended, final question where participants would be able to elaborate on responses provided earlier in the questionnaire, or relate anything else about their learning challenges or university study more generally as they preferred.
These data collection objectives were met by designing and building a complete, self-report, data-collection questionnaire that would be fit-for-purpose in this project. Carefully constructed survey questionnaires are widely used to collect data on individuals' feelings and attitudes that can be easily numericalized to enable statistical analysis (Rattray & Jones, 2007) and are one of the most commonly used process for collecting information in educational contexts (Colosi, 2006). This data collection rationale falls within the scope of survey research methodology in which the process of asking participants questions about the issues being explored are a practical and expedient process of data collection, especially where more controlled experimental processes such as might be conducted in a laboratory, or other methods of observing behaviour for example, are not feasible (Loftus et al, 1985). 
Recent developments in web-browser technologies and electronic survey creation techniques have led to the widespread adoption of questionnaires that can be delivered electronically across the internet (Ritter & Sue, 2007). Given my expertise in web-authoring technologies and that one of the aims of the research project has been to continuously publish it online through a suite of webpages that have grown and developed dynamically to match the progress of the project, the obvious data collection solution has been to build an online questionnaire that can be hosted on the project webpages. Some elements of the online data collection processes remain out the control of the researcher, for example in comparison to face-to-face interviews a self-report questionnaire provides no latitude for a responsive, interactional relationship to emerge between the researcher and the participant which might be useful and appropriate in some circumstances where depth, shades and tones of respondent answers can generate rich, additional data. However the ability to reach a complete university community of potential participants through the precise placement and marketing of a web-based questionnaire was felt to have significant benefits.
These include:
- the ability for the researcher to remain inert in the data collection process and hence reduce any researcher-induced bias; the ability for participant respondents to complete the questionnaire privately, at their own convenience and without interruption which it was hoped would lead to responses that were honest and a reliable, accurate indication of a their views; ease of placement and reach, achieved through the deployment of a weblink to the questionnaire on the home university's main, student, website home page;
- ease of data receipt with the standard design feature included in online surveys of a 'submit' button generating a dataset of the questionnaire responses in tabular form for each participant which was automatically sent by e-mail to the researcher's university mail account;
- the facility for strict confidentiality protocols to be applied whereby a participant's data once submitted was to be anonymous and not attributable to the participant by any means. This was achieved through development of an innovative response form coding process which was built in to the 'submit' feature of the questionnaire form but which still allowed for a participant dataset to be removed from the datapool later should a participant request this, post-submission;
- the ability to ensure that participant consent had been obtained by linking agreement to this to access to the questionnaire.
Substantial technical challenges in the design of the electronic questionnaire were encountered and a brief report about how these were managed is provided below in sub-section ##. Once designed and created, the deployment of the questionnaire was to be focused on two, distinct student groups. These were a) students with known dyslexia at the home university so that the baseline control group could be established; and b) the wider student community at the home university. Challenges in obtaining the cooperation of significant staff at the home university for the deployment to students with dyslexia were encountered resulting in a delay of some months whilst these were resolved. The main issue was an uncertainty that all ethical procedures and protocols had been properly followed, and that complete student-data confidentiality would be preserved. This was despite all Ethics Approval documents being made available, and sight of the final draft of the data-collection questionnaire being given so that assurances that no student names and contact details were part of the data collection were evident. Eventually co-operation and assistance was gained.
Data analysis would use quantitative statistical processes to firstly sort the datapool according to Dyslexia Index (Dx) value criteria as this metric was the independent variable, and secondly to address the research questions and hypotheses, where examining the data for significant differences and effect sizes would be the major part of the analysis. Quantitative data was to be collected in the questionnaire through Likert-style item statements which collectively formed scales and subscales. Collecting self-report data using Likert scales in questionnaires presents a significant challenge because when conventional, fixed anchor points are used - commonly 5- or 7-points - the data produced has to be numercially coded so that it can be statistically analysed. There appears to be a long-standing controversy about whether data coded in this way justifies parametric analysis because the coding process assigns arbitrary numerical values to non-numerical data collection responses. Usually this is an essential first stage of the data analysis process but one which then makes the data neither authentic nor actual (Carifio & Perla, 2007, Carifio & Perla 2008). To manage this issue, an innovative data-range slider was to be developed and incorporated into the questionnaire design which thus would provide much finer anchor-point gradations for each Likert-style scale item, effectively eliminating fixed anchor-points in favour of a continuous scale, hence enabling parametric statistical analysis of the results to be more justifiably conducted.
![]()
Methods

This sub-section provides a report of the actual processes that were designed and developed to collect data, to organize it and then conduct analyses that would enable the outcomes to be applied to the project's research hypotheses.
Outline
As a primary research project the underlying rationale has been to collect data about levels of academic confidence of a sample of university students measured through use of the Academic Behavioural Confidence Scale and to relate the outcomes from this metric to the levels of dyslexia-ness of the students, gauged through the Dyslexia Index (Dx) Profiler, especially developed for this study.
The complete sample is referred to as the 'datapool' and students were recruited as participants using two, parallel processes. Firstly, it was imperative to collect data from a sample of students who were known to have dyslexic learning differences so that a CONTROL research subgroup could be established. These students were recruited with the co-operation of the university's Dyslexia and Disability Service by means of an Invitation to Participate e-mail sent out to all students with dyslexia on the Service's mailing list. Secondly, a sample of students from the wider university student community was recruited, also through an Invitation to Participate which comprised a short, video animation designed to capture the interest of potential participants through its innovative format and subject content. A link to the video together with key features about the research project were displayed on the university's student intranet home webpage for two weeks and hence achieved as maximum publicity exposure as possible for this limited period. The video itself was hosted on the project's webpages. The aim was to recruit as broad a cross-section of students from the wider university community as possible. Both of these participant recruitment processes are described more fully below in sub-section ##. Recruitment was incentivized by offering participants an opportunity to optionally enter a prize draw subsequent to completing the questionnaire with Amazon vouchers as prizes.
The datapool thus comprised two distinct samples of students: one group with a known dyslexia; and another group where it would be assumed that students recruited would either have no dyslexic learning differences, or would have no known dyslexia or previously identified dyslexia. These two groups were subsequently defined as research groups RG:DI (Research Group: Dyslexia Identified (by self-declaration)) and RG:ND (Research Group: No Dyslexia (also by self-declaration)) respectively.
The online survey questionnaire to collect data was developed and hosted on the project webpages. Links to it were provided in the participant recruitment initiatives. Students who chose to participate by following the link were first taken to an introduction (available here) which provided information about the purpose of the research, linked access to a more detailed Research Participant Information Statement which included links to all Ethics Approval Documentation should a potential participant wish to view these, and a Participant Informed Consent Statement which participants were required to confirm that they had viewed before access to the Research Questionnaire was granted.
The Research Questionnaire comprised two major components: the 24-scale-item Academic Behavioural Confidence Scale developed by Sander & Sanders (2006, 2009); and the 20-scale-item Dyslexia Index Profiler, developed specifically for this research project and designed to establish the level of 'dyslexia-ness' of each research participant. Additional background information was collected to provide the demographic context of the datapool which in particular included a short section which asked participants to declare any learning differences of which dyslexia was of primary interest. Additional information was also collected relating to broader psycho-social constructs which, at the time of the design and development of the research questionnaire, were intended to form the key discriminator for gauging levels of dyslexia-ness. However, in the light of a simulation exercise to test the feasibility of this, it was decided that an additional metric should be developed and incorporated into the questionnaire which more directly assessed dyslexia-ness through the lens of study-skills and academic learning management attributes - hence the development of the Dyslexia Index Profiler. This psycho-social data has not been incorporated into the project's data analysis process because inspection of the complete, collated data in the datapool indicated that the research hypotheses could be adequately addressed from data collected through the ABC Scale and the Dyslexia Index Profiler alone. Analysis of this, presently reserved, additional data may form part of a subsequent study at a later date.
Thus the two primary metrics, the ABC Scale and the Dyslexia Index Profiler, were established as the dependent and independent variables respectively and which would be used as the key data sources for the analysis process.
The most important purposes of the Dyslexia Index Profiler were to:
- establish a level of dyslexia-ness typically presented by students with known dyslexia and use this to determine a CONTROL research subgroup from research group RG:DI;
- use this baseline standard for dyslexic students to establish two further research subgroups from research group RG:ND:
- students with no known dyslexic learning differences but who nevertheless were presenting levels of dyslexia-ness that were broadly in line with those from students with dyslexia, hence establishing a TEST research subgroup;
- students with no known dyslexic learning difference that could be reasonably confirmed through presenting very low levels of dyslexia-ness, hence establishing a BASE research subgroup;
Thus levels of academic confidence, as determined by the Academic Behavioural Confidence Scale, could then be compared between the three, research subgroups. The objective was to provide evidence to support the research hypotheses that firstly, students with dyslexia present a significantly lower level of academic confidence than their non-dyslexic peers; but secondly that students with no known dyslexia but who presented levels of dyslexia-ness that were comparable to students with dyslexia, present a significantly higher level of academic confidence than their dyslexia-identified peers. Hence the aim was to be able to tentatively conclude that being identified with dyslexia may negatively impacts on academic confidence at university.
On completing the questionnaire, a participant would submit it online with the post-action form submission process converting questionnaire responses into a e-mail message comprising a dataset in tabular format which would be sent to the researcher's university e-mail account ready for collation and later analysis.
Data process summary
The process flowchart (below) summarizes the sequence of data submission, receipt, collation and analysis processes that were conducted. After sifting respondent questionnaires according to whether dyslexia had been declared or not, raw score data was transferred into the master Excel workbook for initial inspection, cleaning up where all respondents' Dyslexia Index and Academic Behavioural Confidence values were calculated. This then permitted mean average values of both Dx and ABC to be calculated and examined for the three research subgroups. The complete datapool was transferred to the application SPSS for deeper analysis.
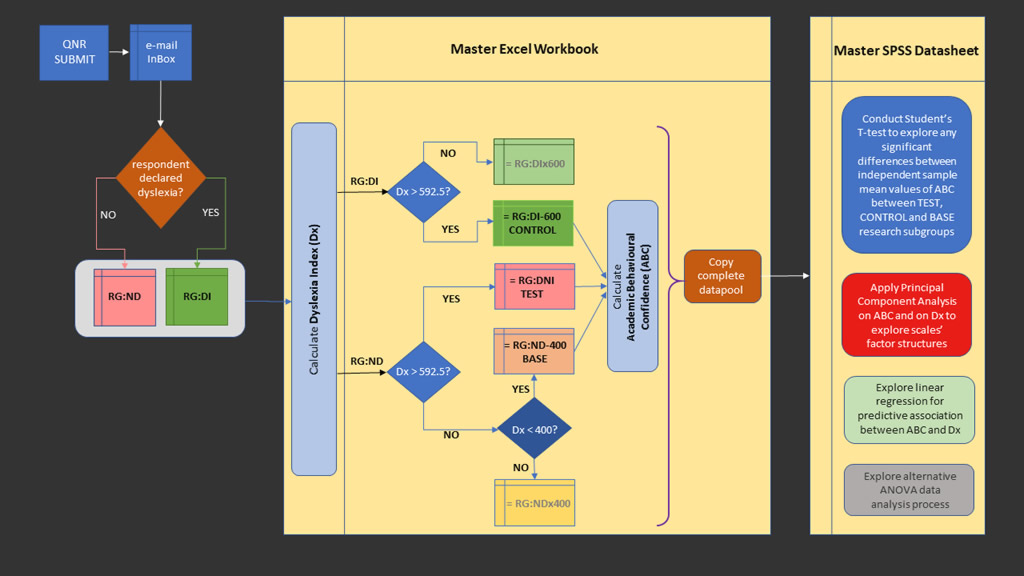
![]()
Establishing the datapool; sample sizes and statistical power; participant recruitment
The datapool sample of students relied on convenience sampling such that the university presented a large cohort of students from which the sample could be drawn, who were studying at all levels, with either home or non-UK residency status. The aim was to recruit as many students as possible although an exploration of the relationship between sample size and statistical power was conducted where this is determined by the ability of the statistical tests used to minimize a false negative result - that is, a Type II error - in relation to the research NULL hypothesis. Skrivanek (2009) defines the power of a statistical test to be the probability that the null hypothesis will be rejected when it is actually false - which represents a correct decision. In contrast, the significance level of a test provides a probability that the null hypothesis will be rejected when it is true, which is an incorrect conclusion. It is important to note that the p-value is a measure of the strength of evidence and is not, directly, a measure of the size or magnitude of the difference (between means). It is possible to have plenty of evidence for a tiny and uninteresting difference, especially in large samples - which is another way of saying that in a large simple, it is quite likely that we might end up with a significant difference. Thus the power of a test is a measure of its ability to correctly reject the null hypothesis. This is useful if it is possible to calculate the power of a test before the data is collected and the statistical analysis is conducted as this will ensure that the sample size is large enough for the purpose of the test and conversely not so large as to most likely arrive at a significant result anyway. This is clearly important since it dismisses the intuitive assumption that the more data there is, the more reliable the results of the analysis will be. Thus there will exist a balance between establishing a sample, the size of which has sufficient power to be likely to generate meaningful analysis outcomes, and the practical conditions which prevail in order for that sample to be established. A test that has 80% power or better is considered to be 'statistically powerful' (Cohen, 1992) so in working backwards from this, it is possible to calculate an ideal sample size that will generate this level of power given that other parameters about the data distribution are either known or can be reliably estimated. In addition, larger differences between means are obviously easier to detect and this will have a (beneficial) impact on the power of a test - that is, increasing the effect size. Sullivan (2009) comments on the balance between effect size and sample size by remarking that it will obviously be easier to detect a larger effect size in a small sample than if the effect size - that is the difference between the means - is small and that conversely, a smaller effect size would require a larger sample in order to correctly identify it. So what is key in this discussion, is that finding a way to establish a sample size that is appropriate for the desired power level is important and Sullivan guides us about how to do this by suggesting that we can either use data from a pilot study, consider the results from similar studies published by other researchers, or think carefully about the minimum difference (between means) that might be considered as important.
However, no such prior studies are available as this project is the first to directly explore differences in Academic Behavioural Confidence in relation to the levels of dyslexia-ness in university students. This means that only a post-hoc estimate of the statistical power of the study can be generated based on the data collected and analysed, and the size of the sample, in this case n=166. This might be considered in tandem with effect size calculations based on between-groups differences rather than associations, and for a future study that might emerge as a post-doctoral development of this one, at least there will now be this current study which could be considered as a pilot for further work on exploring the relationships between academic confidence and dyslexia amongst university students. Nevertheless, a post-hoc estimate of the statistical power of this study is provided in the Results, Analysis & Discussion section more as a demonstration of an awareness of these concepts rather than as a contributor to the key outcomes of the analysis.
In any case for this project it was not known at the outset how effective the participant recruitment process would be. This was especially the case as some resistance was met from the home university towards gaining access to processes for recruiting participants from within the university community. These came from two sources: Firstly, in order to establish the Control subgroup of students with known dyslexia this required proxy access to the cohort of students with dyslexia studying at the university so that research participants could be recruited. As is common in most higher education institutions in the UK, students with dyslexia are usually known to a specifically established support service. These students have generally either been identified on entry to the university as part of the application procedure should they have chosen to disclose their dyslexic learning difference as a disability, or otherwise they are identified, screened and assessed for dyslexia at some point during their courses. Typically this can be as an outcome of a referral by academic staff who are interacting with the student. To gain recruit participants from this student group, an approach was made to the Disability and Dyslexia Service at the home university to explain the nature of the study and to ask for the Service's cooperation in recruiting students with dyslexia as research participants. Although proxy rather than direct access to their student e-mail distribution list was requested and assurances provided that no confidential data would be collected by making available the complete research questionnaire for scrutiny, together with open access to all ethics approval documentation being given, supervisor intervention in addition to an extensive e-mail dialogue was necessary together with face-to-face meetings with the Service's manager before agreement was reached that an Invitation to Participate e-mail would be sent to all students with dyslexia on the Service's database. This unexpected and lengthy negotiation added a delay to the data collection process of approximately 6 months. The second and unrelated challenge was in building a working relationship with the relevant marketing and publicity department at the university so that an Invitation to Participate could be posted as a weblink on the university's student intranet home page. Although the reasons for this were hard to determine precisely, they appeared to rest on challenges establishing decision-making accountability at the university about whether or not it would be appropriate to publicize a student research project in this way. However agreement was finally reached which permitted a research publicity graphic depicting the main idea of the project to be posted as part of a sequence of more general student event notices on the student-facing intranet home webpage. This incorporated a weblink which took the visitor to a short video clip that had been created using the video animator 'Powtoon', as a additional incentive to participate. At the end of the video, participants were invited to continue to the research questionnaire by clicking a further link, which directed them first to the Research Participant Information Page on the project webpages, subsequently leading to the questionnaire itself. The same link to the recruitment publicity video was provided in the Invitation to Participate e-mail distributed to students with dyslexia. Hence all research participants commenced their involvement in the project at the same point.
Invitation to Participate Video Clip:

Hence through these two recruitment processes, students who chose to participate either did so by responding to the Invitation to Participate e-mail which they had received from the Disability and Dyslexia Service, these students subsequently constituted Research Group DI (RG:DI) whilst those who responded to the Invitation to Participate publicity posted on the university's intranet home page subsequently constituted Research Group ND (RG:ND). It was was of no consequence that students with dyslexia who may have found their way to the research questionnaire through the links from the intranet home page rather than as a response to the Disability and Dyslexia Service's e-mail because as part of the opening section, the questionnaire requested responding participants to declare any dyslexic learning challenges and hence would be sifted into RG:DI accordingly.
Every questionnaire response e-mail received was generated by the questionnaire submission process which anonymised the data by labelling the response with a randomly generated 8-figure Questionnaire Response Identifier (QRI). The QRI was automatically added to the data field set in the questionnaire by the post-action process for submitting the form as an e-mail and the QRI was also published to the respondent on the Questionnaire Acknowledgement webpage (available here) which appeared when the questionnaire Submit button was activated. The Questionnaire Acknowledgement page thanked the respondent for participating, presented a complete summary copy of all responses provided in the research questionnaire and added a data withdrawal option through a link to the Participant Revocation Form. Should any participant have chosen to do this (none did), the form requested the QRI so that when submitted, it would be possible to find that dataset and delete it. No respondent contact information was requested as the complete process for data withdrawal could be completed through use of the QRI. The Questionnaire Acknowledgement page also included the option to participate in the prize draw and for this, respondent's contact e-mail or phone number were requested through a short single-entry electronic form but also did not connect these contact details to the QRI. This ensured that complete participant anonymity was preserved at all times making it impossible to connect any specific dataset to any prize draw entrant's e-mail address or phone number for the 166 datasets retained into the datapool. This complete process was approved by the university's Education Department Ethics Sub-Committee as being appropriate and fit for purpose.
![]()
Procedures for data collection, collation and pre-analysis
The graphic below summarizes the complete process for collecting data, indicating how students were recruited through to the data they supplied being received for collation and analysis. Questionnaire responses were received over the course of the following two months, eventually totalling 183 responses. 17 were discarded because they were more than 50% incomplete. Of the remaining 166 good quality datasets, 68 were from students with dyslexia, hence forming Research Group: DI, and 98 were from students declaring no dyslexic learning challenges, forming Research Group: ND.
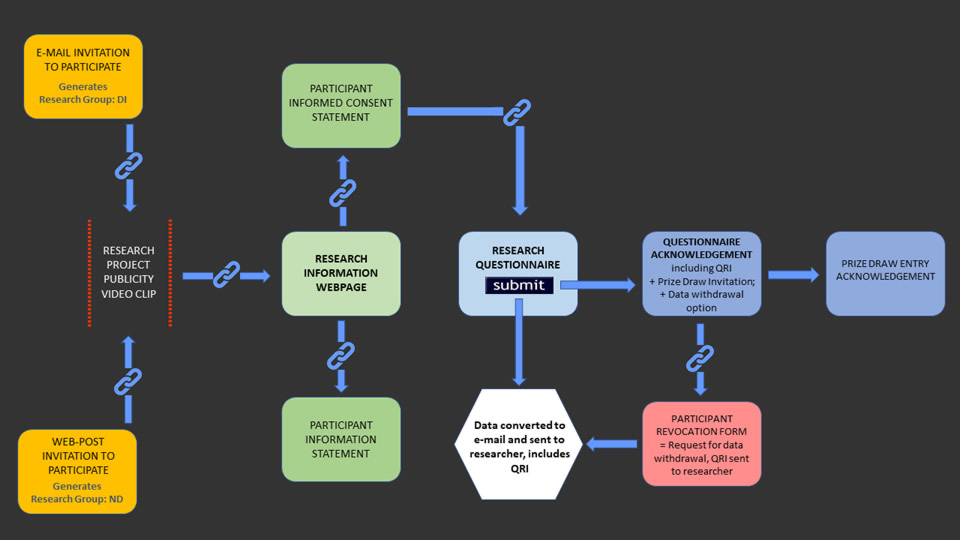
The form post-action submission process for each completed questionnaire converted the set of data-field entries into an e-mail message where the body of the message comprised the data in a tabular format with a .csv file of the data included as an attachment. On receipt, each message was identified as originating from either a student with dyslexia or a student with no declared dyslexia from the form field which requested this information and saved into an appropriately named folder. Subsequently, each .csv file was imported into the master Excel spreadsheet which had been established for the purpose of initially collating all of the datasets received.
The master Excel spreadsheet proved to be entirely appropriate for initial inspection of the data and for some statistical analysis, and has remained useful throughout the data analysis process. For the more detailed statistical analysis that was later required, such as the Principal Component Analysis for the ABC Scale and the Dx Profiler the complete datapool was transferred into the application SPSS. Although already familiar with this tool, the Laerd Statistics SPSS Resource (Lund & Lund, 2018) was consulted to support the later stages of the analysis. Effect size differences were calculated manually (in Excel) and effect size confidence intervals were calculated using a helpful Excel plug-in (Cumming, 2012).
The initial inspection of the collected datasets in Excel enabled the first iteration of Dyslexia Index values (Dx) to be established from the Dyslexia Index Profiler metric using a weighted mean average of the raw score values ranging from 0 to 100, for each of the 20 Dyslexia Index scale items, consistent with the scale-item specifications that had been built in to the Profiler at the design stage (reported fully in Appendix 7.#). This process determined a level of dyslexia-ness for each respondent as a numerical value between 0, suggesting a negligible level of dyslexia-ness, to 1000. Recall that the principal aim of the Dx Profiler is to find students in Research Group ND who declared no dyslexia but who present levels of dyslexia-ness that are more consistent with their peers in research group DI who have indicated that they are dyslexic, hence establishing the TEST research subgroup. The result of this initial data conversion process presented a Dyslexia Index range of 88 < Dx < 909 for students in Research Group ND and a corresponding range of 340 < Dx < 913 for students in Research Group DI which at the outset, appeared to be suggesting that a proportion of students who declared no dyslexic learning challenges in their questionnaire were indeed presenting levels of dyslexia-ness that were of similar values to students in the dyslexic group, indicating that the Dx Profiler was working as designed. Hence this data conversion process enabled the BASE, TEST and CONTROL research subgroups to be generated in accordance with Dyslexia Index boundary values that were established at an early stage in the data analysis process, fully reported in the Results, Analysis and Discussion section. In summary, the boundary value of Dx = 400 was set as the upper boundary for datasets in Research Group ND to be sifted into the BASE research subgroup and a boundary value of Dx = 592.5 set to sift datasets from research group ND into the TEST research subgroup and to sift datasets from research group DI into the CONTROL research subgroup.
Each respondent's Academic Behavioural Confidence value was determined by a simple, mean average of the 24 raw score ABC Scale items comprising the complete scale in the questionnaire. Each scale item ranged from 0 to 100. It is believed that this is the first adaptation of the ABC Scale to provide continuous-scale range input responders in place of the conventional 5-anchor-point Likert-style responders which appear to have been used in every other application of the ABC Scale in research studies found to date. It is noted that a further development of this current research project might focus an enquiry on the ways in which this adaptation of the ABC Scale may affect the scale's internal consistency reliability, its construct validity and its topic sensitivity. Such a study might usefully add to the very small number of studies which have explored these factors and others, such as data quality and response rates, in web-survey design (eg: Roster et al, 2015, Buskirk et al, 2015).
![]()
Designing and building a web-browser-based electronic questionnaire
1. Questionnaire design rationales
The research questionnaire was built to meet clearly established design parameters based firstly on feedback gained from the online questionnaire developed for the project's preceding Master's dissertation (Dykes, 2008) where evidence from participants suggested that the format met the design objective of being broadly 'dyslexia-friendly'. This means that it had used concise, short sentences that avoided subordinate clauses and were aligned to the left margin only; had used a clear, non-serif font with monospaced lettering (although some compromises had to be made to ensure rendering compliance with web-browsers in use at the time); a keen attempt was made to try to ensure that instructions were brief and as minimal as possible, using jargon-free phraseology with concise meaning; it had used a sensible balance of text colour to background colour which retained sufficient contrast to be properly readable but avoided inducing glare or other visual stress aberrations such as shimmering, fuzziness or dancing letters, effects commonly reported by many individuals with dyslexia (Beacham & Szumko, 2005). Overall, guidance provided by the British Dyslexia Association was helpful in meeting many of these design objectives and this was supported by my own experience working with university students with dyslexia in academic skills guidance and Disabled Students' Allowance assistive technologies training at the University of Southampton, 2003-2010. Other literature was consulted, for example to provide further guidance about design features of online and web-based information systems that enabled better access for users with dyslexia (Gregor & Dickinson, 2007, Wabil et al, 2007), about text formats and web design for visually impaired and dyslexic readers that would improve readability which included consulting a particularly helpful checklist of desired design features to assist with dyslexia compliance (Evett & Brown, 2005). Thus the design features of that earlier web-based survey were reviewed, developed and adapted for this project's questionnaire.
Secondly, a range of later research was consulted to explore how dyslexia-friendly online webpage design may have been reviewed and updated in the light of the substantial expansion over the last two decades of online learning initiatives. These have developed within higher education institutions through VLEs (virtual learning environments) and digital learning object platforms such as Xerte and Articulate, and from external sources such as MOOCs and free-course providers such as FutureLearn, all of which rely on modern web-browser functionality (eg: Rello et al, 2012, Chen et al, 2016, Berget et al, 2016). Additionally the literature was consulted to understand how the latest HTML5 web technologies and the rapid rise in usage of smart mobile devices were influencing universal web design (Riley-Huff, 2012, 2015, Henry et al, 2014, Fogli et al, 2014, Baker, 2014). The outcome of this brief literature review notably identified, not unsurprisingly, that online information presentation which enshrined strong accessibility protocols not only enabled better access for those with dyslexia and those who experienced visual stress or who had other vision differences, but provided better accessibility and more straightforward functionality for everyone (McCarthy & Swierenga, 2010). Other literature was consulted for guidance about the impact of design and response formats on data quality (Maloshonok & Terentev, 2016), on response and completion rates (Fan & Yan, 2010), on the effectiveness of prize draw incentivizations (Sanchez-Fernandez et al, 2012) and invitation design (Kaplowitz et al, 2011), and about more general web form design characteristics recommended for effectiveness and accessibility (Baatard, 2012).
Hence the project research questionnaire would be designed according to these specifications:
- it would be an online questionnaire that would render properly in at least the four most popular web-browsers: Google Chrome, Mozilla Firefox, Internet Explorer, Safari (usage popularity respectively 69.9%, 17.8%, 6.1%, 3.6%, data for March 2016 (w3schools.com, 2016)). Advice was provided in the questionnaire pre-amble that these were the best web-browsers for viewing and interacting with the questionnaire and links were provided for downloading the latest versions of the browsers;
- the text, fonts and colours would attempt to follow the latest W3C web-accessibility protocols, balanced against design styles that would make the questionnaire attractive to view and easy to engage with. W3C Web Accessibility Initiative Guidelines were consulted for this purpose (W3C WAI, 2016);
- the briefest of information would be provided in an opening pre-amble relating to the nature of the research and what it was trying to explore; this would be a condensed recap of information provided in the Participant Information Statement and the Participant Informed Consent Statement;
- an estimate would be provided about how long it would take to complete the questionnaire;
- questions were to be grouped into short, distinct sections, each focusing on a specific aspect of the research, with each question-group to be viewable on the webpage one section at a time. The intention was to try to ensure that respondents would be encouraged to work through the full questionnaire and not be deterred by its length in an attempt to reduce the onset of survey fatigue and poor completion rates (McPeake et al, 2014, Ganassali, 2008, Flowerdew & Martin, 2008, Marcus et al, 2007, Cohen & Manion, 1994); In the event, only 17 of the 183 questionnaires returned were incomplete.
- a minimum of demographic information would be collected at the top of the questionnaire to enable a rapid progression to the main features;
- the main body of the questionnaire would use Likert-style scale items that in groups, constituted scales, and present these scale items as response options using range sliders to gauge respondent acquiescence to the scale item statements. This would be in preference to the more conventional approach of using radio buttons more typically seen in web surveys with Likert-style response options using fixed anchor-point gradations. This was to meet the data analysis criteria that as far as possible, data collected would be as close to continuous as possible rather than discrete, hence enabling parametric statistical analysis later, an argument strongly supported in literature consulted (Jamieson, 2004, Pell, 2005, Carifio & Perla, 2007, 2008, Grace-Martin, 2008, Ladd, 2009, Norman, 2010, Murray, 2013, Mirciouiu & Atkinson, 2017 (consulted later)). However the issue about conducting parametric analysis on data generated from Likert-style scales does remain controversial, aggravated by a tendency amongst researchers to not clearly demonstrate their understanding of the differences between Likert-style scales and Likert-style scale items (Brown, 2011), compounded by also not properly clarifying whether their scales are gauging nominal, ordinal, or interval (i.e. continuous) variables;
- the questionnaire scale item statements would be written to read as neutrally as possible or comprise a blend of negatively- to positively-phrased wording to try to avoid suggesting that the focus of the questionnaire was on evaluating the impacts of learning difficulty, disability or other learning challenge on studying at university, but rather that the research was using a balanced approach to explore a range of study strengths as well as challenges. A range of literature was consulted to support this design criteria which on the one hand confirmed the desirability of balancing negative to positive wordings (eg: Sudman & Bradburn 1982) although other evidence showed that wording 'polarity' can influence respondent's answers to individual questions with 'no' being a more likely response to negative questions than 'yes' is, to positively worded ones (Kamoen et al, 2013). Barnette (2000) found evidence through internal reliability consistency analysis that the widely claimed supposition that survey items worded negatively as an attempt to encourage respondents to be more attendant to the items was dubious at best, and also that mixing item stem polarity may be confusing to respondents. Hence applying scale item statement neutrality where possible was considered as the safest approach for minimizing bias that might be introduced through scale item statement wording;
- a free-writing field would be included to try to encourage participants to feel engaged with the research by providing an opportunity to make further comments about their studies at university in whatever form they wished. This had proved to be a popular survey item in the preceding Masters dissertation questionnaire (Dykes, 2008) with information provided by respondents who opted to volunteer their thoughts, feelings and opinions providing rich, qualitative data that aided the data analysis process. Any qualitative data collected in this way would be incorporated apositely in the data analysis process later;
- after completing all sections, submitting the questionnaire form would trigger an acknowledgement webpage to open, where a copy of the responses submitted would be available to view together with an opportunity to request revocation of the data if desired;
- each participant's completed questionnaire response would generate a unique identifier when submitted so that any individual dataset could be identified and withdrawn if this was requested, and the data removed from the data collation spreadsheet; in the event, no participants requested their data to be withdrawn.
The final part of the questionnaire design preparation stage was to conduct a brief review of existing web survey applications currently widely available to determine if any of these provided sufficiently flexible design customizability to meet the design specifications that had been scoped out. The applications reviewed included Google Forms, SurveyMonkey, Typeform, SurveyLegend, Polldaddy, Survey Planet, Survey Nuts, Zoho Survey, Survey Gizmo. However, the limitations of all of these proprietary survey design applications were numerous and broadly similar from one app to another. These included for example: limited number of respondents per survey; strictly constrained design and functionality options; advertising or custom-branding. These were limitations which could only, and variously, be removed by subscribing to payment plans. None of the apps reviewed included the functionality to replace their standard radio buttom response selection format with range input sliders. Hence given existing expertise in web form design and in web-authoring more generally, it was considered expedient to design and build a questionnaire web survey form from scratch that could meet all the design specifications identified and be hosted on the project's webpages.
[The final, published version of the research questionnaire is available to view, below.]
2. Questionnaire construction and the HTML5 scaffolding
The research questionnaire webpage adopted the styling features of the project webpages and opened with an introductory paragraph which explained the purpose of the research, sketched out the structure of the questionnaire itself, provided an estimate of completion time and also indicated recommended web browsers for the best interactive experience.
The questionnaire itself was constructed as a (web) form with the data input fields set through form field input properties. These included various input selectors such as drop-down menus, radio buttons and for the main body of the questionnaire, input range sliders which were created to be functional, easy to use and visually appealing using CSS (cascading style sheet) styling protocols. The input range sliders were used to collect respondent data inputs on all of the Likert-style scale items contained in the questionnaire.
Each section of the questionnaire was accessed using the HTML Spry Accordion Panels feature which enabled each Likert scale to be revealed on demand by clicking its panel header. Once one section had been completed, clicking the panel header to open the next section automatically closed the previous section so that only one section of the questionnaire was viewable at a time. It was possible to return to any section at any time by clicking its panel header so that responses could be amended.
The foot of the questionnaire webpage presented a short, closing paragraph which thanked the participant for their responses, provided information about how the completed questionnaire would be sent to the researcher, explained the process for entering the prize draw participation incentive and also explained the process for data withdrawal. The final questionnaire webpage item was the submit button, labelled: 'Send my answers' which activated a standard, proprietary form script which converted the data supplied in each of the form fields into an e-mail which included the data as a .csv file for direct import into the master Excel spreadsheet.
![]()
3. Questionnaire sections and components
The final iteration of the design and construction process resulted in a questionnaire that comprised five respondent data input sections presented in this order:
- Participant demographics:
A brief question-set to collect demographic data: simple drop-down menu selectors were provided for respondent gender, their residency category where two choices were offered: 'home', 'overseas or international'; and their student status where seven choices were offered: 'undergraduate student', 'post-graduate student', post-graduate research student', post-doctoral researcher', 'foundation or access course student', '[completing] a professional or vocational course', 'something else'. Also included in this opening section was a request for the respondent to declare whether they had any specific learning challenges that they were aware of, with two choices offered: 'none' and 'those indicated in this list' for which seven choices were provided in a drop-down menu: 'dyslexia', 'attention deficit hyperactive disorder', attention deficit disorder', aspergers syndrome', dyspraxia', 'dyscalculia', 'something else'. Finally, participants who had declared 'dyslexia' as their specific learning challenge were invited to further declare how they had learned of their dyslexia by choosing options from two drop-down menus that completed the sentence:- 'My dyslexia was disclosed/described/identified/diagnosed to me as a learning disability/difference/weakness/strength/deficit/difficulty'.
- Gauging academic confidence: The Academic Behavioural Confidence Scale:
The second section of the questionnaire contained the Academic Behavioural Confidence Scale (Sander & Sanders, 2003, 2006, 2009) in its complete, original 24-scale-item format. Each scale item completed the stem statement: 'How confident are you that you will be able to ...' provided at the top of the list of scale items. To register a response, a slider control had to be adjusted from its default, '50% confident' position along a range scale from 0% to 100%. The % position of the slider control was displayed in a small active window to the right of the slider.
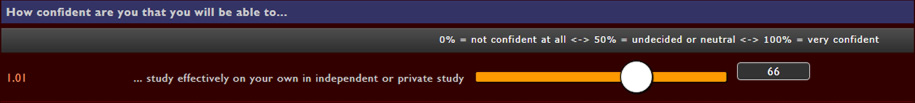
Once submitted, data acquired through the ABC Scale was collated into the master spreadsheet and a mean average ABC value was calculated for each respondent with no weightings associated with any ABC dimension applied. The mean average ABC score was hence the dependent variable in the study. To recap, the Academic Behavioural Confidence Scale emerged out of an early study exploring university students' expectations of teaching (Sander et al, 2000). The outcomes of this study indicated the merit for engaging students at university in enquiries that were effectively seeking their feedback in relation to the teaching that they were experiencing on their courses and their wider expectations and study preferences at university. A subsequent paper focused more keenly on the data collection process that had been used in the earlier study, identifying that the explanations suggested to account for the interesting group differences revealed by the question-set that had been constructed, could be collectively considered to be gauging academic confidence amongst the students surveyed (Sander & Sanders, 2003), especially as it had drawn on much of the earlier work by Bandura relating to self-efficacy in academic study which had been identified as the parent construct for academic confidence. Sander & Sanders proposed that academic confidence might be considered as "a mediating variable between the individual's inherent abilities, their learning styles and the opportunities afforded by the academic environment of higher education" (ibid, p4). The 24-item question set was defined the Academic Confidence Scale with later developmental work following further studies leading to the scale being renamed as the Academic Behavioural Confidence (ABC) Scale because it was considered to be focusing on "confidence in actions and plans related to academic study" (Sanders & Sander, 2007, p635). It is thus considered that precedents have been widely set for using the ABC Scale in enquiries relating to students' approaches to their studies at university and their learning behaviours, styles and preferences, collectively operationalized as their academic confidence, and so in this current study it has been used in the complete, 24-item, unabridged format. - The 6 psycho-sociometric constructs:
The next part of the questionnaire aimed to gauge each respondent's degree of acquiescence towards 36 statements grouped into 6 subscales of 6 scale-items. The subscales were attempting to evaluate a respondent's score for each of the 6 psycho-sociometric constructs respectively: Learning Related Emotions, Anxiety regulation & Motivation, Academic Self-Efficacy, Self-Esteem, Learned Helplessness, and Academic Procrastination. The rationale was supported by evidence from literature which suggested that discernable differences existed between dyslexic and non-dyslexic individuals in each of these constructs. For example, that levels of self-esteem are depressed in dyslexic individuals in comparison to their non-dyslexic peers (eg: Riddick et al, 1999, Humphrey, 2002, Burton, 2004, Alexander-Passe, 2006, Terras et al, 2009, Glazzard, 2010, Nalavany et al, 2013). Humphrey & Mullins (2002) looked at several factors that influenced the ways in which dyslexic children perceived themselves as learners, identifying learned helplessness as a significant characteristic; and a study by Klassen et al (2008) compared levels of procrastination between students with and without dyslexia finding that dyslexic students exhibited significantly higher levels of procrastination when tackling their academic studies at university in comparison to students with no indication of a dyslexic learning disability. Hence at this stage in the research design process, it was considered possible that this profile visualization idea may have had sufficient discriminative power in this current study to enable quasi-dyslexic students to be identified from the research group of non-dyslexic students, this being fundamental to addressing the research hypotheses. Each scale item completed the stem statement: 'To what extent do you agree or disagree with these statements ...' where 0% indicated strong disagreement to 100%, registering strong agreement. Statements presented included, for example: 'I find it quite difficult to concentrate on my work most of the time', 'I approach my written work with a high expectation of success', 'I often felt pretty stupid at school'. For this current project the original rationale had been to use the data collected in these subscales to enable strong, 6-axis radar-chart visualizations (right)to be generated which would be broadly based on the locus of control profiles created in the preceding Masters dissertation (Dykes 2008). In that study, promise had been shown for these visualizations to have discriminative properties such that students with dyslexia presented distinctive profile sets that were in contrast to those generated from the data for non-dyslexic students.
To trial the idea in advance of the research questionnaire becoming active, psuedo data was generated to try to simulate expected results for a typically dyslexic, and a typically non-dyslexic individual, based on stereotypical rationales built from my own experience of working with students with dyslexia at university and prior evidence from the previous study (Dykes, 2008). Profiles of mean-average pseudo-data for dyslexic and non-dyslexia generated the background profiles and a known non-dyslexic individual was used to generate the 'This Respondent' profile. Although the resulting visualizations were quite different to each other concern emerged about whether the profiles generated from the real data collected in the research questionnaire later would present sufficiently visible differences to enable the profile charts to be accurately used as a discriminating tool. It seemed likely that identifying the profile anomalies would be relying on a 'by eye' judgement in the absence of a more scientific, data-analysis-based criteria that was either readily available or possible to formulate. Therefore it was considered that a more robust, defendable and quantitative process would be required as the discriminator between dyslexic and non-dyslexic students that could be used as the identifier of quasi-dyslexic students to comprise the Test research subgroup. Even so, the data visualizations were highly interesting and so this section of the questionnaire would remain included and once data had been collected, the complete set of profile charts were constructed. It is possible that this process and data may be explored properly as part of a later study. The example presented here (right) shows the profile chart generated from data submitted by research participant #11098724, a respondent who had declared a known dyslexic learning challenge, overlaid onto the profiles of mean average data. It can be seen that there are significant differences between the profile of the mean average data for all students in the datapool with dyslexia, in comparison to the profile of the mean average data for all other students in the datapool. This is particularly noticeable for the constructs Anxiety regulation & Motivation and Learned Helplessness. It can also be seen that the profile for this dyslexic student overlaid onto these is clearly more aligned with the dyslexics' mean profile than the non-dyslexics' mean profile. The full set of profile charts are available here.
Hence the Dyslexic Index (Dx) Profiler was designed and developed, initially as a belt-and-braces backstop to cover the eventuality that the profile visualizations proved inappropriate as a discriminator. In the end, the data collected through the Dx Profiler proved entirely appropriate and sufficient for addressing the research hypotheses. - Gauging dyslexia-ness: The Dyslexia Index Profiler:
This section of the questionnaire completed the quantitative aspect of the data collection process and comprised the 20 Likert-style scale items which constituted the Dyslexia Index Profiler. In the questionnaire, each scale item followed the theme set so far by collecting a participant response through a continuous range input slider to measure the degree of participant acquiescence with a statement, each one of which represented one dimension of dyslexia-ness. The set of dimension statements were collectively prefixed at the head of the section with the stem query: 'To what extent do you agree or disagree with these statements ...'. Range input sliders could be set at a value between 0% to represent strong disagreement with the dimension statement to 100%, representing strong agreement. In the construction stage of the questionnaire, the statements were ordered in a way which broadly grouped statements thematically but this order was then scrambled using a random number generator to set the order in which the statements were presented in the final iteration of the questionnaire. This was to reduce the likelihood of order-effect bias as there is some evidence that the sequence of questions or statements in a survey may induce a question-priming effect in respondents, such that a response provided for one statement or question subsequently influences the response for the following question when these appear to be gauging the same or a similar aspect of the construct under scrutiny (McFarland, 1981). Data collected in this section was transferred into the master spreadsheet and a weighted mean average Dyslexia Index (Dx) value calculated. The weighting process is described elsewhere in this thesis report. The resulting Dx value was set as the independent variable in the study so that each respondent's Dyslexia Index was to be associated with their corresponding level of Academic Behavioural Confidence. - How can studying at university be improved? Supporting qualitative data:
A precedent had been set for collecting additional, qualitative data as this had elicited thoughtful and reflective supporting material (Dykes, 2008). In the introductory pre-amble to this questionnaire respondents were told that the focus of the research was to explore learning strengths, challenges and preferences in response to the demands of academic tasks at university. Hence this final part of the questionnaire provided an opportunity for respondents to disclose anything else about their study at university, with a suggestion being made in the introduction that hearing about how studying at university could be improved in ways that might better suit their learning and study circumstances may be of particular interest. A more focused account and analysis of this qualitative data is reserved for the moment with a view to generating a detailed report as part of a subsequent study later. However were pertinent, aspects of this qualitative data has been included in the Analysis and Discussion section.
The complete questionnaire was trialled in a pilot amongst a small student peer-group known to the researcher (n=10) to gain feedback about its style of presentation, its ease of use, the clarity of the questions and statements, the quality of the introductory pre-amble, the length of time it took to complete the questionnaire and any issues that had arisen in the way it had displayed in the web-browser used, and for any other more general comments that might indicate a review or partial review of the questionnaire before proper deployment. The outcome of this small pilot indicated that no significant amendments were required as the questionnaire was considered as innovative, engaging, clearly presented and easy to understand and use.
![]()
Construction of the Dyslexia Index Profiler
The Dyslexia Index (Dx) Profiler forms the final 20-item Likert scale on the main questionnaire for this project and attempts to establish the levels of dyslexia-ness of all respondents by requesting them to: 'reflect on other* aspects of approaches to your studying or your learning history - perhaps related to difficulties you may have had at school - and also asks about your time management and organizational skills more generally.' (*other is in reference to the earlier parts of the complete questionnaire).
 Aside from basing the Dx Profiler on evidence (discussed in the Theoretical Perspective section earlier) about characteristics of dyslexia typically observed amongst university students who had been identified with the syndrome, an additional foundation to the Profiler was sought which aimed to make it more robust and increase its construct validity by collecting data about the prevalence and frequency of attributes, that is, dimensions of dyslexia encountered by dyslexia support professionals in their interactions with dyslexic students at their universities. To meet this objective a brief web-survey was designed, built and hosted on the project webpages and a link to the survey was included in an introductory Invitation to Participate sent by e-mail to the Student Service for students with dyslexia at universities across the UK. Where a specific dyslexia support service could not be identified from universities' webpages, the e-mail was sent to a more general university enquiries e-mail address. Through this process, 116 out of the 132 UK Higher Education Institutions identified through the Universities UK database were contacted. Only 30 replies were received which although was disappointing, it was considered that the data in these replies was rich enough to provide a substantive baseline for usefully contributing to the development of the Dyslexia Index Profiler.
The rationale for this preliminary enquiry was twofold:
- By exploring the prevalence of attributes (dimensions) of dyslexia observed 'at the chalkface' in addition to those distilled through the theory and literature reviewed to that point, it was hoped that the data acquired would confirm that the dimensions being gauged through the enquiry were indeed significant features of the learning and study profiles of dyslexic students at university. An additional feature of the enquiry was to provide space for respondents to add other dimensions that they had encountered and which were relevant. These are shown below together with comments about how they were dealt with;
- Through analysis of the data collected, value weightings would be ascribed to the dimensions in proportion to their relative prevalence which could be incorporated into the data analysis of the output from the Dyslexia Index Profiler when deployed in the main research questionnaire later, which would thus attempt to adjust the output of the Profiler to accommodate the relative strengths of dimensions derived from their prevalence. Hence a level of dyslexia-ness based on a weighted mean average of values recorded in each of the dimensions would be established for all respondents. This would the most important feature of the Profiler so that it could be utilised as a discriminator to establish the three research subgroups of interest, the TEST, CONTROL and BASE subgroups.
The survey comprised a bank of 18 statements collectively preceded by the interrogative: 'in your interactions with students with dyslexia, to what extent do you encounter each of these dimensions?' An attempt has been made to try choose the wording of the statements carefully so that the complete bank has a balance of positively-worded, negatively-worded and neutral statements overall. There is evidence that to ignore this feature of questionnaire design can impact on internal consistency reliability although the practice, despite being widespread in questionnaire design, remains controversial (Barnette, 2000) with other more recent studies reporting that the matter is far from clear and requires further research (Weijters et al, 2010). This issue has been briefly discussed already in this thesis (above). Nevertheless, it was considered that adjusting statement polarity to try to present a balance was justified.
The 18 statements, labelled 'Dimension 01 ... 18' were:
- students’ spelling is generally very poor
- students say that they find it very challenging to manage their time effectively
- students say that they can explain things more easily verbally than in their writing
- student show evidence of being very disorganized most of the time
- in their writing, students say that they often use the wrong word for their intended meaning
- students seldom remember appointments and/or rarely arrive on time for them
- students say that when reading, they sometimes re-read the same line or miss out a line altogether
- students show evidence of having difficulty putting their writing ideas into a sensible order
- students show evidence of a preference for mindmaps or diagrams rather than making lists or bullet points when planning their work
- students show evidence of poor short-term (and/or working) memory – for example: remembering telephone numbers
- students say that they find following directions to get to places challenging or confusing
- when scoping out projects or planning their work, students express a preference for looking at the ‘big picture’ rather than focusing on details
- students show evidence of creative or innovative problem-solving capabilities
- students report difficulties making sense of lists of instructions
- students report regularly getting their ‘lefts’ and ‘rights’ mixed up
- students report their tutors telling them that their essays or assignments are confusing to read
- students show evidence of difficulties in being systematic when searching for information or learning resources
- students are very unwilling or show anxiety when asked to read ‘out loud’
Aside from its data collection purpose, a main feature of the design of the survey was to act as a sandbox for trying out design ideas favoured for inclusion in the main (student participant) questionnaire to be developed and deployed later. Principle amongst these ideas was to discard the conventionally-favoured Likert scale-item discrete scale-point anchors with input-range sliders for respondents to record their inputs. The rationale for this has been discussed in more detail above. Thus respondents were requested to judge the frequency (extent) that each dimension was typically encountered in interactions with dyslexic students as a percentage of all interactions with dyslexic students by moving the slider along the scale, which ranged from 0%, labelled 'never', with the default position set at 50%, labelled 'in about half' to 100%, labelled 'all the time'. For example in the statement: "students show evidence of being disorganized most of the time" a respondent who judged that they 'see' this dimension in a very significant proportion of their dyslexic student interactions might return, say, '80%' as their response to this statement.
It was anticipated that respondents would naturally dis-count repeat visitors from this estimate although to do so was not made explicit in the instructions so that the preamble to the questionnaire could be as brief as possible. It is recognized that there is a difference between 80% of students being 'disorganized' and 'disorganization' being encountered in 80% of interactions with students. However it was felt that since an overall 'feel' for prevalence was the aim for the questionnaire, the difference was as much a matter of syntax as distinguishable meaning and so the way in which respondents interpreted the idea of 'the extent to which' in the opening interrogative was considered of marginal concern.
The default position was set at the midpoint of the slider scale, established after considering that adjusting a slider one way or the other from a neutral point seemed an obvious starting point as it marked the neutral position. With hindsight, it may have been better to have set the default position at 0% since, intuitively at least, such a strategy ought to encourage respondents to provide more thoughtfully considered, 'active' responses whereas with the default set at 50% this may encourage a more benign response. Whether this would have had a significant impact on the results is not known and could only have been established by testing the two alternative default formats prior to deployment for which time was not available. However one early study which explored the effect of different survey design features included an examination about how the default position of input range sliders impacted on output, reporting no significant differences found between the zero position being set as the default in comparison to the midpoint of a range scale (Couper et al, 2006). The incorporation of continuous rating scales, often referred to as visual analogue scales, in online survey research is relatively new although as new web-authoring protocols are being developed the process is now becoming easier to implement in web-survey designs and hence the effects of such innovations on data quality and participant responses are beginning to attract research interest (Treiblmaier & Flizmoser, 2011). Thus this baseline enquiry also served the very useful purpose of testing the continuous range input sliders for gaining feedback about whether their use may be an appropriate data collection device suitable for designing in to the project's main research questionnaire later, or whether the safer alternative should be to revert to more conventionally constructed Likert scales items with fixed anchor points. To have reverted to that would have been disappointing, especially given the range of evidence (cited earlier) on the merit of using input-range sliders as a device to increase data quality (Funke & Reips, 2012). Hence it was encouraging that positive feedback was received from several respondents who typically expressed a particular liked for the clarity and ease of use of the sliders, and functionality that they provided to enable much finer response judgements to be made. Hence this data collection design feature was indeed included in the main research questionnaire deployed to students later.
It is acknowledged that the 18 dimensions chosen do not constitute an exhaustive list of dimensions of dyslexia - whatever this might be - and in the preamble to the questionnaire this was acknowledged. To accommodate this, an opportunity in the survey was provided for colleagues to record other, common (for them at least) attributes encountered during their interactions with dyslexic students that did not appear in the survey's statement list. This was in the form of a 'free text area' placed at the foot of the questionnaire. Where colleagues listed other attributes, they were also requested to provide a % indication of the prevalence. In total, an additional 24 additional attributes were reported with 16 of these indicated by just one respondent each. 2 more were reported by each of 6 further respondents, 1 more reported by each of 3 respondents and 1 more reported by 4 respondents. To make this clearer to understand, the complete set is presented below:
| Additional attribute reported | % prevalence | |||
| poor confidence in performing routine tasks | 90 | 85 | 80 | *n/r |
| slow reading | 100 | 80 | *n/r | |
| low self-esteem | 85 | 45 | ||
| anxiety related to academic achievement | 80 | 60 | ||
| pronunciation difficulties / pronunciation of unfamiliar vocabulary | 75 | 70 | ||
| finding the correct word when speaking | 75 | 50 | ||
| difficulties taking notes and absorbing information simultaneously | 75 | *n/r | ||
| getting ideas from 'in my head' to 'on the paper' | 60 | *n/r | ||
| trouble concentrating when listening | 80 | |||
| difficulties proof-reading | 80 | |||
| difficulties ordering thoughts | 75 | |||
| difficulties remembering what they wanted to say | 75 | |||
| poor grasp of a range of academic skills | 75 | |||
| not being able to keep up with note-taking | 75 | |||
| getting lost in lectures | 75 | |||
| remembering what's been read | 70 | |||
| difficulties choosing the correct word from a spellchecker | 60 | |||
| meeting deadlines | 60 | |||
| focusing on detail before looking at the 'big picture' | 60 | |||
| difficulties writing a sentence that makes sense | 50 | |||
| handwriting legibility | 50 | |||
| being highly organized in deference to 'getting things done' | 25 | |||
| having to re-read several times to understand meaning | n/r | |||
| profound lack of awareness of their own academic difficulties | *n/r | |||
| (* n/r = % not reported) | ||||
It is of note that the additional attribute most commonly reported referred to students' confidence in performing routine tasks, by which it is assumed is meant 'academic tasks'. Although this was reported by only 4 respondents out of the 30 surveyed, this resonates with the rationale for deploying the Academic Behavioural Confidence in the main research questionnaire as a metric to gauge academic confidence because it was expected that significant differences between students with dyslexia and those without would emerge. Hence to factor the construct of 'confidence' into the Dyslexia Index Profiler was considered unnecessary.
Respondents completed the survey by submitting their questionnaire electronically which converted the data into a tabular format where each dimension was listed against the score that the respondent had ascribed to it, thus forming the body of an automatically generated e-mail message. Data received from the questionnaire submissions were collated into a spreadsheet and in the first instance the mean average prevalence for each dimension was calculated. Additionally, standard deviations and standard errors so that 95% confidence intervals for the background population means for each dimension could be established to provide an idea of variability. The sample mean prevalence is the most important outcome because this is an indication of the average frequency (that is, extent) that each of these dimensions were encountered by dyslexia support professionals in university settings. For example, the dimension that was encountered with the greatest frequency on average, is 'students show evidence of having difficulty putting their writing ideas into a sensible order' with a mean average prevalence of close to 76%. The table below presents the dimensions according to the average prevalence which in addition to meeting the design objectives of the survey, presents an interesting snapshot of 'in the field' encounters.
| dim# | Dyslexia dimension | mean prevalence | st dev | st err | 95% CI for µ |
| 8 | students show evidence of having difficulty putting their writing ideas into a sensible order | 75.7 | 14.75 | 2.69 | 70.33 < µ < 81.07 |
| 7 | students say that when reading, they sometimes re-read the same line or miss out a line altogether | 74.6 | 14.88 | 2.72 | 69.15 < µ < 79.98 |
| 10 | students show evidence of poor short-term (and/or working) memory - for example, remembering telephone numbers | 74.5 | 14.77 | 2.70 | 69.09 < µ < 79.84 |
| 18 | students are very unwilling or show anxiety when asked to read 'out loud' | 71.7 | 17.30 | 3.16 | 65.44 < µ < 78.03 |
| 3 | students say that they can explain things more easily verbally than in their writing | 70.6 | 15.75 | 2.88 | 64.84 < µ < 76.30 |
| 16 | students report their tutors telling them that their essays or assignments are confusing to read | 70.4 | 14.60 | 2.67 | 65.09 < µ < 75.71 |
| 2 | students say that they find it very challenging to manage their time effectively | 69.9 | 17.20 | 3.14 | 63.67 < µ < 76.19 |
| 17 | students show evidence of difficulties in being systematic when searching for information or learning resources | 64.3 | 19.48 | 3.56 | 57.21 < µ < 71.39 |
| 13 | student show evidence of creative or innovative problem-solving capabilities | 63.2 | 19.55 | 3.57 | 56.08 < µ < 70.32 |
| 4 | students show evidence of being very disorganized most of the time | 57.2 | 20.35 | 3.72 | 49.79 < µ < 64.61 |
| 12 | when scoping out projects or planning their work, students express a preference for looking at the 'big picture' rather than focusing on details | 57.1 | 18.00 | 3.29 | 50.58 < µ < 63.69 |
| 9 | students show evidence of a preference for mindmaps or diagrams rather than making lists or bullet points when planning their work | 56.7 | 17.44 | 3.18 | 50.32 < µ < 63.01 |
| 1 | students' spelling is generally poor | 52.9 | 21.02 | 3.84 | 45.22 < µ < 60.52 |
| 11 | student say that they find following directions to get to places challenging or confusing | 52.3 | 20.74 | 3.79 | 44.78 < µ < 59.88 |
| 14 | students report difficulties making sense of lists of instructions | 52.0 | 22.13 | 4.04 | 43.98 < µ < 60.09 |
| 15 | students report regularly getting their 'lefts' and 'rights' mixed up | 51.7 | 18.89 | 3.45 | 44.83 < µ < 58.57 |
| 5 | in their writing, students say that they often use the wrong word for their intended meaning | 47.8 | 20.06 | 3.66 | 40.46 < µ < 55.07 |
| 6 | students seldom remember appointments and/or rarely arrive on time for them | 35.7 | 19.95 | 3.64 | 28.41 < µ < 42.93 |
The graphic below shows the relative rankings of all 18 dimensions again, but with added, hypothetical numbers of interactions with dyslexic students in which any particular dimension would be presented based on the mean average prevalence. These have been calculated by assuming a baseline number of student interactions of 100 for each questionnaire respondent (that is, professional colleagues who responded to this baseline enquiry), hence generating a total hypothetical number of interactions of 3000 (30 survey respondents x 100 interactions each). The graphic below shows the relative rankings of all 18 dimensions again, So for example, the mean average prevalence for the dimension 'students show evidence of having difficulty putting their writing ideas into a sensible order' is 75.7% based on the data collected from all respondents. This means that we might expect any one of our dyslexia support specialists to experience approximately 76 (independent) student interactions presenting this dimension out of every 100 student interactions in total. Scaled up as a proportion of the baseline 3000 interactions, this produces an expected number of interactions of 2271 presenting this dimension.
Complex and fiddly as this process may sound at first, it was found to be very useful for gaining a better understanding of what the data means. With hindsight, it may have enabled a clearer interpretation to have been made if the preamble to the questionnaire had very explicitly made clear that the interest was in independent student interactions to try to ensure that colleagues did not count the same student visiting on two separate occasions presenting the same dimension each time. It is acknowledged that this may be a limiting factor in the consistency of the data collected and mention of this has already been made above. It should be noted that this survey has provided data about the prevalence of these 18 dimensions of dyslexia not from a self-reporting process amongst dyslexic students, but on the observation of these dimensions occurring in interactions between professional colleagues supporting dyslexia and the dyslexic students they are working with in HE institutions across the UK. The survey did not ask respondents to state the number of interactions on which their estimates of the prevalence of dimensions were based over any particular time period, but based on how busy dyslexia support professionals in universities are known to be, not least taken from my own experience of working alongside them as an academic guide or a learning development tutor in the three universities where I have had these student-facing roles, it might be safe to assume that the total number of interactions on which respondents' estimates were based is likely to have been reasonable.
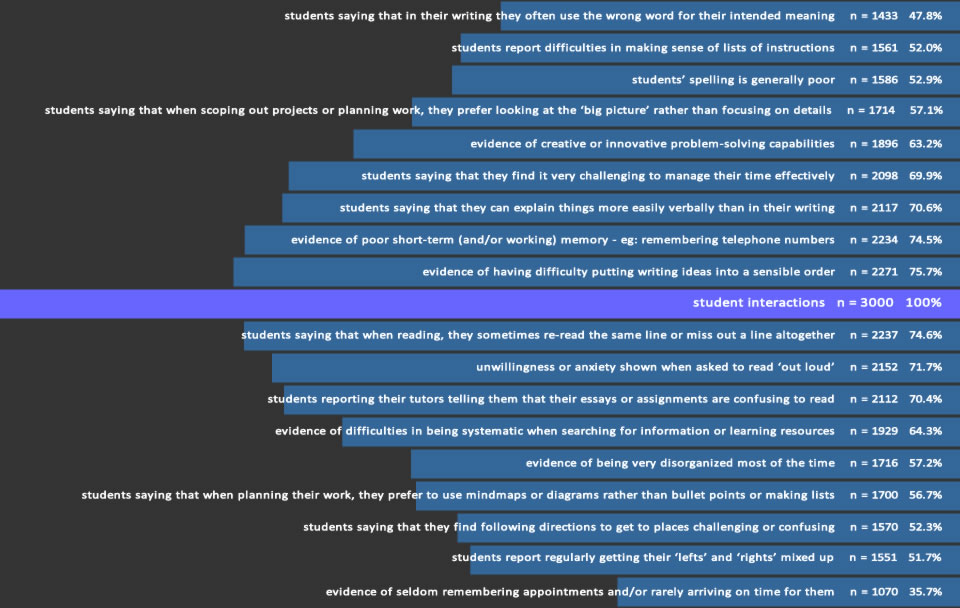
The objective of the survey has been to inform the development of the Dyslexia Index (Dx) Profiler. Although it is acknowledged that the survey was more in line with a 'straw poll' than a scientific research study, it was considered that the design objective was met and the outcome provided encouragement for including all 18 dimensions into the Dx Profiler. However reflecting on the results it was considered that to attribute them all with an equal weighting would be to dismiss the relative prevalence of each dimension, determined from their rankings of mean prevalence shown in the table below. Hence once built in to the Dyslexia Index Profiler, aggregating input-values provided by respondents to each dimension in the Profiler on a weighted mean basis would generate a Dyslexia Index value - their level of dyslexia-ness - that will be a more representative indication of any one respondent presenting a dyslexia-like profile of study attributes or not. Hence this may then be a much more reliable discriminator for sifting out quasi-dyslexic students from the wider research group of (declared) non-dyslexic students to generate the TEST research subgroup, and to also establish the CONTROL, and BASE research subgroups for the subsequent comparisons of Academic Behavioural Confidence to be applied. It is planned that a full report of this survey which will include a more detailed analysis and reflection on the outcomes will be reported later as a small development of this current project, possibly as a submission for publication in due course.
![]()
Feeding these results into the construction of the Dx Profiler
In the main research questionnaire, the Dyslexia Index Profiler formed the final section. All 18 dimensions were included and were reworded slightly into 1st person statements. Respondents were requested to adjust the input-value slider to register their degree of acquiescence with each of the statements. Two additional dimensions were included to provide some information about learning biography, one to gain a sense of how the respondent remembered difficulties they may have experienced in learning to read in early years, and the other about similar-letter displacement mistakes in their early writing:
- when I was learning to read at school, I often felt I was slower than others in my class
- In my writing at school, I often mixed up similar letters like 'b' and 'd' or 'p' and 'q'
These additional statement-dimensions were included because to accommodate the wealth of research evidence relating to (conventionally defined) dyslexia in children is that it is regularly characterised and often initially suspected by a child's early difficulties in acquiring peer-comparative reading skills where letter reversals in early writing often also occurs and is suggested to be one factor which aggravates the visual decoding of letter combinations into sounds internally possibly contributing to inconsistencies in reading comprehension or mis-comprehension of words, both singularly and in sentence contexts (Lachmann & Gueyer, 2003, Liberman et al, 1971). These dimensions were not included in the baseline survey to dyslexia support professionals as it was felt that they would be unlikely to have knowledge about these aspects of a student's learning biography. The table below lists all 20 dimensions in the order and phraseology in which they were presented in the main research questionnaire, together with the weighting (w) assigned to each dimension's output value. It can be seen that the two additional dimensions were each weighted by a factor of 0.80 to acknowledge the strong association of these characteristics of learning challenges in early reading and writing with dyslexia biographies.
Hence the 18 dimensions surveyed earlier together with the two additional ones above formed the statement-set for the Dyslexia Index Profiler. Dimensions were re-phrased into the first person to encourage a reflective engagement with the participant and in order to meet one of the key design objectives for the Profiler that it should show applicability to all student respondents rather than just students with dyslexia. It was felt that this rephrasing process together with shifting the emphasis of the statement-set away from necessarily implying deficit and difficulty throughout, should be sufficient to achieve this. For example, the dimension explored in the baseline survey of: 'students' spelling is generally poor' is rephrased in the Dyslexia Index Profiler to: 'My spelling is generally good'. Given poor spelling is a typical characteristic of dyslexia in early-years writing, it would be expected that although many dyslexic students at university have improved their spelling competencies in comparison to early years difficulties, it remains a weakness in many with significant reliance on technology-associated spellcheckers for correct spellings. The hopefully honest response in the Profiler would reflect this with it being typically expected that a dyslexic student would be more likely than not to strongly disagree with this dimension-statement.
| item # | item statement | weighting |
| 3.01 | When I was learning to read at school, I often felt I was slower than others in my class | 0.80 |
| 3.02 | My spelling is generally very good | 0.53 |
| 3.03 | I find it very challenging to manage my time efficiently | 0.70 |
| 3.04 | I can explain things to people much more easily verbally than in my writing | 0.71 |
| 3.05 | I think I am a highly organized learner | 0.43 |
| 3.06 | In my writing I frequently use the wrong word for my intended meaning | 0.48 |
| 3.07 | I generally remember appointments and arrive on time | 0.64 |
| 3.08 | When I'm reading, I sometimes read the same line again or miss out a line altogether | 0.75 |
| 3.09 | I have difficulty putting my writing ideas into a sensible order | 0.76 |
| 3.10 | In my writing at school, I often mixed up similar letters like 'b' and 'd' or 'p' and 'q' | 0.80 |
| 3.11 | When I'm planning my work I use diagrams or mindmaps rather than lists or bullet points | 0.57 |
| 3.12 | I'm hopeless at remembering things like telephone numbers | 0.75 |
| 3.13 | I find following directions to get to places quite straightforward | 0.48 |
| 3.14 | I prefer looking at the 'big picture' rather than focusing on the details | 0.57 |
| 3.15 | My friends say I often think in unusual or creative ways to solve problems | 0.63 |
| 3.16 | I find it really challenging to make sense of a list of instructions | 0.52 |
| 3.17 | I get my 'lefts' and 'rights' easily mixed up | 0.52 |
| 3.18 | My tutors often tell me that my essays or assignments are confusing to read | 0.70 |
| 3.19 | I get in a muddle when I'm searching for learning resources or information | 0.64 |
| 3.20 | I get really anxious if I'm asked to read 'out loud' | 0.72 |
However it is recognized that designing questionnaire items in such a way as to best ensure the strongest veracity of responses can be challenging. Setting aside design styles that seek to minimize random error, the research literature reviewed appears otherwise inconclusive about the cleanest methods to choose and, significantly, little research appears to have been conducted about the impact of potentially confounding, latent variables hidden in response styles that may be dependent on questionnaire formatting (Weijters, et al, 2004). Possible post-hoc, analysis measures such as Cronbach's α can at least provide some idea about a scale's internal consistency reliability although at the level of this research project, it has not been possible to consider the variability in values of Cronbach's α that may arise through gaining data from the same respondents but through different questionnaire styles, design or statement wording. Nevertheless, this 'unknown' is recognized as a potential limitation of the data collection process that must be mentioned and these aspects of questionnaire design will be expanded upon in more detail in the final thesis.
Reverse coding data
Having accepted that a balance of positively and negatively-phrased statements in the Dyslexia Index (Dx) Profiler is desirable, this nevertheless brings other issues, not least because the data collected is numerical in nature and aggregate summary values are to be calculated for each respondent to arrive at the Dyslexia Index value, thus representative of their level of dyslexia-ness. For each of the dimension statements in the Profiler, a marker of dyslexia was expected to be indicated by either a high score or by a low score being recorded on the input range slider, depending on the nature of the statement. Since the scale is designed to provide a numerical indicator of a 'dyslexia-ness', it seemed appropriate to aggregate the input-values that were recorded by respondents in such a way that a high final Dx value points towards a strong dyslexic profile, that is, a high-level of dyslexia-ness. However, were dimension-statement values aggregated together without paying attention to whether a high value or a low value would be an indicator for dyslexia these values would likely cancel each other out when aggregated into the finl Dyslexia Index value. It had been planned to reverse code scores for some statements so that the overall calculation to the final Dyslexia Index would not be upset by high and low scores both indicating high levels of dyslexianess cancelling each other. In the first instance this was considered intuitively and below is the complete list of 20 statements showing whether a 'high score=strong agreement (H)' or a 'low score=strong disagreement (L)' was expected to be the dyslexic marker. Thus for the statement: 'my spelling is generally good' where it is widely acknowledged that individuals with dyslexia tend to be poor spellers, a low score indicating strong disagreement with the statement would thus be the marker for dyslexia and so respondent values for this statement would be reverse-coded when aggregated into the final Dyslexia Index.
Whilst this 'by eye' H/L assignment process outwardly appeared satisfactory, it was somewhat unscientific. Thus to consider a little more formally which dimensions should have their scores reverse-coded a Pearson Product-Moment Correlation was run to calculate values for the correlation coefficient, r, for a measure of the association between each statement and the complete aggregated Dyslexia Index (Dx) value. The value for the dimension being considered being temporarily removed from the aggregate in each case. Of course this was only possible once the complete datapool of questionnaire outputs had been received at the end of the project's data collection process. It was felt that exploring this may provide a clearer picture for deciding which statements' data values should be reverse-coded and which others should be left in their raw form. It is acknowledged that this process still has limitations, one of which is that even with the dimension being correlated with the others being removed from the aggregate, that may still leave other dimensions in the aggregation which would subsequently be shown to be better included were their values reverse-coded. However, the exercise was still considered worthwhile and the full set of resulting values of r are also included in the table below.
The deciding criteria used was this: if the expectation is to reverse-code a statement's data and this is supported by a strong negative correlation coefficient, hence indicating that statement is negatively correlated with Dx, then the reverse-coding process would be applied to the data. If the correlation coefficient indicates anything else – that is ranging from weak negative to strong positive – the data would be left as it is. H/L indicates whether a High or a Low score is expected to be a marker for dyslexia and 'RC' indicates a statement that is to be reverse-coded as a result of considering r.
It can been seen from the summary table that the only dimension that has eventually been reverse-coded has been dimension #2: 'my spelling is generally very good' as this was the only one that presented a relatively high negative correlation with Dx of r = - 0.51. It of note that of the other dimensions that were thought likely to require reverse-coding indicated in the table 'L', their correlations with Dx is close to zero which suggests that either reverse-coding or not will make little appreciable difference to the aggregated final Dyslexia Index.
Once the complete datapool had been established from the 166 main research questionnaire responses submitted, it was possible to look more closely at correlation coefficient relationships between the dimensions. The complete table of results can be found in the Analysis & Discussion section of this thesis where a more incisive analysis is offered. It of note though, that by also running a Student's t-test for identifying differences between independent samples' means (at the 0.05 critical level, one-tail test ), for the mean value of each of the 20 dimensions in the Dyslexia Index Profiler between the two primary research groups, RG:DI, students with declared dyslexia, n=68 and the remaining respondents, RG:ND, assumed to have no formally identified dyslexia, n = 98, significant differences between the means were identified for 16 out of the 20 dimensions. This data table is also found in the Analysis & Results section but it is worthy of note here that the t-test outcomes were no significant differences were indicated between the dimensions' sample means were for dimensions:
- Dimension #3: I find it very challenging to manage my time effectively; (t = -1.1592, p = 0.113)
- Dimension #5: I think I am a highly organized learner; (t = -0.363, p = 0.717)
- Dimension #7: I generally remember appointments and arrive on time; (t = 0.816, p = 0.416)
- Dimension #13: I find following directions to get to places quite straightforward; (t = 0.488, p = 0.626)
This result indicates that these four dimensions are having little or no impact on the overall value of the Dyslexia Index (Dx), at least in terms of contributing towards an indication of dyslexia-ness because no significant differences were detected between dyslexic and non-dyslexic students in these four dimensions. This further suggests that by removing these 4 dimensions from the statement-list in the Profiler, it would remain and equally good discriminator for levels of dyslexia-ness. In fact these same four dimensions were identified through the Cronbach's Alpha analysis as being possibly redundant items in the scale (details below). T-test results for all the other 16 dimensions produced p-value results at very close to zero indicating very highly significant differences for each dimensions' mean values between the research group of dyslexic students and the remaining participants' datasets. More is said about this in the next sub-section, reporting work completed to explore the internal consistency reliability of the Dyslexia Index metric.
![]()
Internal consistency reliability - Cronbach's α
 It has been possible to assess the internal consistency reliability of the Dyslexia Index Profiler more formally after the 166 datasets that were received were collated into the software application SPSS by establishing the Cronbach's alpha (α) coefficient which is widely used to establish the supposed internal reliability of data collection scales. It is important to take into account however, that the coefficient is a measure for determining the extent to which scale items reflect the consistency of scores obtained in specific samples and does not assess the reliability of the scale per se (Boyle et al, 2015), because it is reporting a feature or property of the individuals' responses who have actually taken part in the questionnaire process. This means that although the alpha value provides some indication of internal consistency it is not necessarily evaluating the homogeneity, that is, the unidimensionality of a set of items that constitute a scale.
It would be expected that a meta-analysis of several broadly similar studies which had all used the scale being evaluated would be required before more general confidence in the internal consistency reliability of the scale could be established. Since the Dyslexia Index (Dx) metric has been especially developed for use in this current project this is not possible. Nevertheless, and with this caveat in mind, applying the Cronbach's alpha process to the Dx metric can provide a useful indicator of its likely internal consistency reliability.
It has been possible to assess the internal consistency reliability of the Dyslexia Index Profiler more formally after the 166 datasets that were received were collated into the software application SPSS by establishing the Cronbach's alpha (α) coefficient which is widely used to establish the supposed internal reliability of data collection scales. It is important to take into account however, that the coefficient is a measure for determining the extent to which scale items reflect the consistency of scores obtained in specific samples and does not assess the reliability of the scale per se (Boyle et al, 2015), because it is reporting a feature or property of the individuals' responses who have actually taken part in the questionnaire process. This means that although the alpha value provides some indication of internal consistency it is not necessarily evaluating the homogeneity, that is, the unidimensionality of a set of items that constitute a scale.
It would be expected that a meta-analysis of several broadly similar studies which had all used the scale being evaluated would be required before more general confidence in the internal consistency reliability of the scale could be established. Since the Dyslexia Index (Dx) metric has been especially developed for use in this current project this is not possible. Nevertheless, and with this caveat in mind, applying the Cronbach's alpha process to the Dx metric can provide a useful indicator of its likely internal consistency reliability.
The α value for the Dyslexia Index (Dx) 20-item scale computed to α = 0.852 which is indicating a high level of internal consistency reliability. An alpha value within the range 0.3 < α < 0.7 is considered as acceptable with preferred values being closest to the upper limit in this range (Kline, 1986). However Kline also proposed that a value of α > 0.7 may be indicating that the scale contains redundant items whose values are not providing much new information. It is encouraging to note that the same, four dimensions as identified and described in the section above did emerge as the most likely, 'redundant' scale items, hence suggesting that the development of a reduced, 16-item scale for Dyslexia Index would be an appropriate. For the datapool in this project, excluding the four, identified scale items from the Dyslexia Index metric was explored to determine the impact this would have on the overall Dyslexia Index value for all respondents. The outcome showed some small differences: mean Dx value = 531.25 for the complete datapool for the Dx-20-item scale with a data range of 88 < Dx < 913 whereas if the 16-item Dx scale is used, the mean Dx value = 525.40 with a data range of 31 < Dx < 961. This indicates that there is likely to be no significant difference between the mean Dx values if either the 20-item or the 16-item scale is used and this was confirmed as not significant at the 5% level using a 2-tail independent samples t-test assuming homoscedastic variances (t=0.2880 , p=0.7736).
Reporting more than Cronbach's α: confidence intervals
Further reading about internal consistency reliability coefficients has identified studies which firstly identify persistent weaknesses in the reporting of data reliability in research, particularly in the field of social sciences (eg Henson, 2001, Onwuegbuzie & Daniel, 2000, 2002). Secondly, useful frameworks are suggested for a better process for reporting and interpreting internal consistency reliability estimates which, it is argued, then present a more comprehensive picture of the reliability of data collection procedures, particularly data elicited through self-report questionnaires. Henson (op cit) strongly emphasizes the point that 'internal consistency coefficients are not direct measures of reliability, but rather are theoretical estimates derived from classical test theory' (2001, p177), which resonates with Boyle's (2015, above) interpretation about the sense of this measure being relational to the sample from which the scale data is derived rather than directly indicative of the reliability of the scale more generally. However Boyle's view relating to the scale item homogeneity appears to contrast with Henson's who, contrary to Boyle's argument, does state that internal consistency measures do indeed offer an insight into whether or not scale items are combining to measure the same construct. Henson strongly advocates that when (scale) item relationship correlations are of a high order, this indicates that the scale as a whole is gauging the construct of interest with some degree of consistency – that is, that the scores obtained from this sample at least, are reliable (Henson, 2001, p180). This apparent perversity is less than helpful. Onwuegbuzie and Daniel (2002) base their very helpful paper on much of Henson's work but go further by presenting recommendations to researchers which proposes that the following guidelines that takes the α coefficient output further by presenting a report which in addition to quoting the α value should also estimate a confidence interval for α, paying particular attention to the upper-tail value.
The idea of providing a confidence interval for Cronbach's α is attractive, since, as being discussed here, we now know that the value of the coefficient is relating information about the internal consistency of scores for items making up a scale that pertains to that particular sample. Hence it then represents merely a point estimate of the likely internal consistency reliability of the scale, (and of course, the construct of interest), for all samples taken from the background population. But interval estimates are better, especially as the point estimate value, α, is claimed by Cronbach himself in his original paper (1951) to be most likely a lower-bound estimate of score consistency, implying that the traditionally calculated and reported single value of α is likely to be an under-estimate of the true internal consistency reliability of the scale were it to be applied to the background population. So Onwuegbuzie and Daniel's suggestion that one-sided confidence intervals (the upper bound) are reported in addition to the value of Cronbach's α is a good guide for more comprehensively reporting the internal consistency reliability of data because it is this value which is more likely to be close to the true value.
Calculating the upper-limit confidence value for Cronbach's α
Confidence intervals are most usually specified to provide an interval estimate for the population mean using sample data to do this by using a sample mean – which is a point estimate for the population mean – and building the confidence interval estimate based on the assumption that the background population follows the normal distribution. So it follows that any point estimate of a population parameter might also have a confidence interval estimate constructed around it provided we can accept the most underlying assumption that the distribution of the parameter is normal. For a correlation coefficient between two variables in a sample, this is a point estimate of the correlation coefficient between the two variables in the background population and if we took a separate sample from the population we might expect a different correlation coefficient to be produced although there is a good chance that it would be of a similar order. Hence a distribution of correlation coefficients would emerge, much akin to the distribution of sample means that constitutes the fundamental tenet of the Central Limit Theorem and which permits us to generate confidence intervals for a background population mean based on sample data.
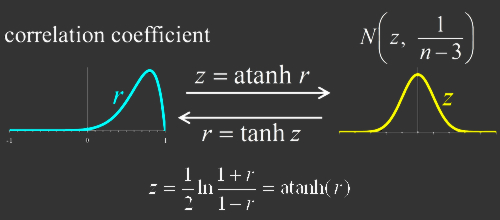 Fisher (1915) explored this idea to arrive at a transformation that maps the Pearson Product-Moment Correlation Coefficient, r , onto a value, Z', which he showed to be approximately normally distributed and hence, confidence interval estimates could be constructed. Given that Cronbach's α is essentially based on values of r, we can use Fisher's Z' to transform Cronbach's α and subsequently apply the standard processes for creating our confidence interval estimates for the range of values of α we might expect in the background population. Fisher showed that the standard error of Z', which is obviously required in the construction of confidence intervals, to be solely related to the sample size: SE = 1/√(n-3), with the transformation process for generating Z' shown in the graphic (right).
So now the upper-tail 95% confidence interval limit can be generated for Cronbach alpha values and to do this, the step-by-step process described by Onwuegbuzie and Daniel (op cit) was worked through by following a useful example of the process outlined by Lane (2013):
- Transform the value for Cronbach's α to Fisher's Z'
- Calculate the Standard Error (SE) for Z'
- Calculate the upper 95% confidence limit for Z' + (SE)*Z [for the upper tail of 95% two-tail confidence interval, Z = 1.96]
- Transform the upper confidence limit for Z' back to a Cronbach's α internal consistency reliability coefficient.
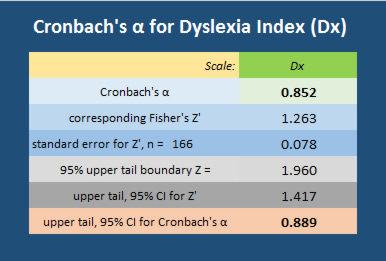 A number of online tools for transforming to Fisher's Z' were found but the preference has been to establish this independently in Excel using the z-function transformation shown in the graphic above. The table (right) shows the set of cell calculation step-results from the Excel spreadsheet and particularly, the result for the upper 95% confidence limit for α for the Dyslexia Index Profiler scale (α = 0.889). So this completes the first part of Onwuegbuzie & Daniel's (2002) additional recommendation by reporting not only the internal reliability coefficient, α, for the Dyslexia Index Profiler scale, but also the upper tail boundary value for the 95% confidence interval for α.
The second part of their suggested improved reporting of Cronbach's α requires the same parameters to be reported for the subgroups of the main research group. In this study the datapool comprises the distinct groups of a) student respondents who declared their existing identification of dyslexia and b) those others who indicated that they had no known learning challenges. As outlined earlier, these are designated research group DI (n = 68) and research group ND (n = 98) respectively. SPSS was then used again to analyse scale reliability and the Excel spreadsheet calculator function has generated the upper tail 95% CI limit for α. Results are shown collectively in the table (right, and below).
These tables show the difference in the root values of α for each of the research subgroups: Dx - ND, α = 0.842; Dx - DI, α = 0.689. These are both 'respectable' values for Cronbach's α coefficient of internal consistency reliability although at the moment I cannot explain why the value of α = 0.852 for the complete research datapool is higher than either of these values, which is puzzling. This will be explored later and reported. However, it is clear to see that, assuming discrepancies are resolved with a satisfactory explanation, the upper tail confidence interval boundaries for not only the complete research group but also both subgroups all present an α value that indicates a strong degree of internal consistency reliability for the Dyslexia Index scale, notwithstanding Kline's earlier caveats mentioned above.
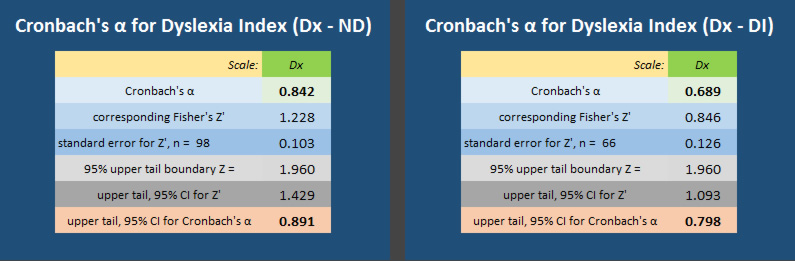
In conclusion, this sub-section has presented a detailed report on the attention that has been paid to the internal consistency reliability of the Dyslexia Index metric which has been developed especially for this project. The complete, 20-item Dx scale, has been shown to present an internal consistency reliability coefficient, Cronbach's α = 0.852 which is very good to the point of suggesting some item redundancy. Further analysis identified 4 scale items that may be redundant but when all of these were removed, leaving a 16-scale-item metric, re-calculating and then comparing the Dyslexia Index mean values showed there to be no significant difference between them. For future studies, this suggests that the reduced, 16-item scale would be perfectly sufficient for gauging measures of Dyslexia Index and hence determining levels of dyslexia-ness. Following further recommendations, values of Cronbach's α were also calculated for the principal research groups, ND and DI with outputs of α=0.842 and α=0.689 respectively. In addition to reporting the single internal consistency reliability coefficient for the complete datapool and for each of the two principle research groups, upper-tail, 95% confidence interval boundary values were also calculated which returned values of α=0.889, 0.891 and 0.798 for the complete datapool, RG:ND and RG:DI respectively.
On this basis, it is considered that the Dyslexia Index metric presents good internal consistency reliability, and the original, 20-item scale has been used for the later analysis in conjunction with the Academic Behavioural Confidence Scale.
![]()
Correlations between Dyslexia Index dimensions - in advance of Principal Component Analysis
Despite the thoroughness of the approach reported directly above, it emerged through a further review of pertinent literature that Schmitt (1996) highlights research weaknesses that are exposed by relying on Cronbach's Alpha alone to inform the reliability of questionnaires' scales, proposing that additional evaluators about the inter-relatedness of scale items should also be reported, particularly, inter-correlations. Hence in addition to using SPSS to generate the root α value for the complete 20 scale-item Dx metric (α=0.852) the application was also used to calculate a matrix of dimension inter-correlations for the complete datapool n=166.
For exploring whether scale-item redundancy may exist in the Dx metric, this may be identified by strong associations (correlations) between pairs of dimensions which may suggest that a parent dimension would be equally effective at gauging this aspect of dyslexia-ness. For example, noting the correlation coefficient r = 0.635 between scale item statements: 'I get really anxious if I'm asked to read 'out loud'' and 'When I'm reading, I sometimes read the same line again or miss out a line altogether' this indicates a strong association between these two dimensions. That is, a student who mis-reads lines of text typically gets anxious if asked to read out loud - not an unsurprising result. Hence it may be possible to exclude one of the other of these dimensions from the metric because the correlation suggest a typical outcome for one, provided that the other has actually been evaluated in the metric. In a future iteration of the Dx metric, it would be worth reflecting on how this potential parent dimension may be described and hence use it as a single alternative to the two dimensions which are its contributors. In contrast, note the value of r = -0.446, between scale item statements: 'I think I'm a highly organized learner' and 'I find it very challenging to manage my time efficiently' which although is not quite such a strong association is nevertheless significant. It is indicating, also not unsurprisingly, that a student who finds it challenging to time-manage is unlikely to be highly organized and hence we might reasonably assume the likelihood of one dimension based on the evaluation of the other.
Other quite strong associations are revealed in the complete matrix and although many of the association-pair linkages are equally unsurprising it is suggested that a further development of this project's work will be to explore the nature of these associations more deeply and report on this in a later paper.
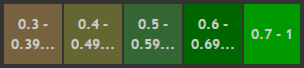


 |
0.635 | |||||||||||||||||||
 |
0.583 | 0.557 | ||||||||||||||||||
 |
0.478 | 0.498 | 0.488 | |||||||||||||||||
 |
0.433 | 0.621 | 0.433 | 0.583 | ||||||||||||||||
 |
0.406 | 0.418 | 0.400 | 0.513 | 0.356 | |||||||||||||||
 |
0.153 | 0.202 | 0.294 | 0.251 | 0.269 | 0.157 | ||||||||||||||
 |
0.255 | 0.272 | 0.264 | 0.363 | 0.335 | 0.365 | 0.310 | |||||||||||||
 |
0.379 | 0.369 | 0.339 | 0.549 | 0.492 | 0.420 | 0.310 | 0.456 | ||||||||||||
 |
0.231 | 0.267 | 0.295 | 0.454 | 0.368 | 0.248 | 0.272 | 0.216 | 0.396 | |||||||||||
 |
0.356 | 0.441 | 0.401 | 0.541 | 0.393 | 0.493 | 0.333 | 0.450 | 0.430 | 0.259 | ||||||||||
 |
0.395 | 0.445 | 0.405 | 0.517 | 0.567 | 0.310 | 0.353 | 0.335 | 0.507 | 0.362 | 0.469 | |||||||||
 |
0.153 | 0.401 | 0.382 | 0.409 | 0.474 | 0.307 | 0.310 | 0.329 | 0.392 | 0.337 | 0.539 | 0.353 | ||||||||
 |
0.017 | -0.018 | 0.011 | -0.048 | -0.201 | -0.113 | 0.014 | 0.022 | -0.048 | 0.035 | -0.029 | -0.166 | -0.225 | |||||||
 |
0.000 | 0.106 | 0.094 | 0.092 | 0.318 | -0.024 | 0.169 | 0.013 | 0.034 | 0.139 | 0.090 | 0.312 | 0.034 | -0.446 | ||||||
 |
-0.105 | -0.093 | -0.062 | 0.030 | -0.090 | -0.083 | -0.146 | -0.163 | -0.110 | 0.004 | -0.054 | -0.125 | -0.243 | 0.414 | -0.291 | |||||
 |
0.019 | 0.178 | 0.127 | 0.177 | 0.244 | 0.027 | 0.193 | 0.099 | 0.005 | 0.240 | 0.127 | 0.005 | 0.048 | 0.102 | 0.084 | 0.173 | ||||
 |
0.189 | 0.332 | 0.315 | 0.484 | 0.395 | 0.259 | 0.221 | 0.107 | 0.279 | 0.205 | 0.253 | 0.356 | 0.286 | -0.056 | 0.183 | 0.123 | 0.316 | |||
 |
-0.100 | -0.025 | -0.008 | -0.097 | 0.017 | -0.140 | 0.019 | -0.150 | -0.059 | 0.071 | -0.096 | -0.104 | -0.083 | 0.123 | -0.088 | 0.198 | 0.134 | -0.049 | ||
 |
0.331 | 0.360 | 0.365 | 0.319 | 0.349 | 0.296 | 0.134 | 0.306 | 0.207 | 0.160 | 0.352 | 0.306 | 0.333 | -0.041 | 0.190 | -0.181 | 0.151 | 0.225 | -0.191 |
Principal Component Analysis (PCA) of the Dyslexia Index metric; data visualizations
The complete results of the dimension reduction process (PCA) are reported in detail in the Analysis and Discussion section where some hypotheses on what these analysis outcomes may mean are also suggested. It is pertinent to summarize here that the outcome of the PCA indicated a 5-factor structure for the Dyslexia Index scale:
- Reading, writing, spelling
- Thinking and processing
- Organization and time management
- Verbalizing and scoping
- Working memory
Aside from the process of dimension reduction being highly useful for trying to gain a clearer understanding about how the 20 dimensions which comprise the statement-set of the Dx Profiler are grouped into factor families, it has enabled highly interesting visualizations of each research respondent's Dyslexia Index dimensional traits to be created (below).
By setting out the dimensions radially as a radar plot, grouped into their respective factors, an overview of the Dyslexia Index profile of each respondent has been created and when these are overlaid onto mean average summary profiles that have been generated from the datasets of all respondents in each of the two principle research groups (RG:ND and RG:DI) we have an instant overview of any one individual's profile in comparison to mean values. This visualization process embodies the original idea for a dyslexia-ness discriminator that was set out in the early stages of the research design formulation process for this project and as outlined earlier, it was hoped that these visualizations would have been sufficiently discinct to enable quasi-dyslexic students to have been identified from the non-dyslexic group. There remains considerable scope for developing this idea as it is believed that although it may fall short in meeting its original design objectives in this study, as a visual output of the Dyslexia Index Profiler the radar plot of the dimensions and factors does present a useful overview of an individual's learning strengths but more so provide a readily interpretable indication of academic learning management components where learning development interventions may be likely to be of benefit.
 In the first of the three examples below the respondent shown was from the non-dyslexic subgroup although this individual's Dyslexia Index (Dx), established from the Dyslexia Index Profiler being reported in this section, was at a value more in line with those research participants who had disclosed their dyslexia (Dx = 682.5, in comparison with the mean value for the subgroup of dyslexic students of Dx = 662.82, and of the subgroup of non-dyslexic students of Dx = 396.33). The radial axes are scaled from 0 to 100 and as can be seen, this respondent's profile is clearly skewed towards the mean dyslexic profile in the three sectors north-west to east (using a compass analogy) with additional close similarity with other dimensional markers. Setting aside the visual appeal of this presentation of this respondent's profile and the holistic overview of the spectrum of dimensions that it captures, it can be seen that as a broad indication of where this student is likely to be experiencing academic challenges, this representation of strengths and weaknesses could be of significant use to a university learning development and support professional who has been approached by this student for some help and guidance towards improving the quality of their academic output. The second and third examples are also profiles of students from the non-dyslexic subgroup but who present Dyslexia Index values of Dx = 708.6 and 655.3 respectively. These are provided to demonstrate examples of different dimensional profiles but which still aggregate to a Dyslexia Index that is close to the mean Dx value for the dyslexic subgroup. This appears to be adding substance to the argument that by looking at an individual's apparent dyslexia-ness on a dimension by dimension basis, a better understanding of how these dimensions may impact on their academic study regime and hence provide a valuable insight into developing effective learning scaffolds that might enable this learner to better understand their academic strengths and how these may be used to advantage whilst at the same time, create learning development strategies that reduce the impact of challenges. As a baseline reference, the mean Dyslexia Index for subgroup of dyslexic students was Dx = 662.84, and for the subgroup of non-dyslexic students, the mean was Dx = 396.33.
Example 1 (above): This student declared no dyslexic learning difference however their Dyslexia Index of Dx = 682.5 indicated a level of dyslexia-ness more in line with the mean value of students with dyslexia.
Example 2 (above): This visualization shows a level of dyslexia-ness of Dx = 708.6 and is the profile of a student who also declared no dyslexic learning difference.
Example 3(above): With a Dx = 655.3, this student also indicated no dyslexic learning difference.
Developing this profile visualization concept will be a project for further research where the focus will particularly be on creating a data connection infrastructure that can enable these profiles to be generated directly from a respondent's inputs on the Dyslexia Index Profiler, in itself for development at a later stage but which is presented in a very early pilot form here in the reduced, 16-scale item format. It is thought that a pilot trial in a university Learning Development Service of the Dx Profiler and the interlinked visualizations would be a valuable exercise for determining how useful this evaluation of academic learning management competencies in all students might be helpful in more productively matching learner needs to academic skills strategies development that might make the university learning experience both more productive and enjoyable for the student. Hopefully it will be possible to design implement a trial that can meet these research objectives.
![]()
The final, published version of the research questionnaire:
Reproduced below is an active, functional copy of the complete research questionnaire as published on the project's webpages and deployed to research participants. It is possible to try out the Dyslexia Index Profiler alone in a slightly abbreviated version but which provides an instant Dyslexia Index evaluation (available here). This is a pilot version of the stand-alone profiler which it is hoped may be the focus of a post-doc development project later.
![]()
Statistical tools and processes
This sub-section briefly reports on the statistical processes that have been used to analyse the data and the rationales for using them.
- Use of the T-test in preference to ANOVA:
This enquiry has collected data from student participants so that evidence can be prepared and presented to address the research hypothesis that academic confidence, as gauged through the Academic Behavioural Confidence Scale is affected by levels of dyslexia-ness indicated by a Dyslexia Index (Dx) value, gauged through the Dyslexia Index Profiler. Through the adoption and adaptation of the ABC Scale and the careful design and development of the Dyslexia Index Profiler, both of these metrics are considered as CONTINUOUS variables, dependent, independent respectively. Although the datapool has been sifted into research subgroups, namely dyslexic students with strong levels of dyslexia-ness, the CONTROL subgroup; students with weak or negligible levels of dyslexia-ness, the BASE subgroup; and apparently non-dyslexic students but with strong levels of dyslexia-ness, the TEST subgroup, across the complete datapool dyslexia-ness remained as a continuous variable and individual students' data response pairings between the two variables were preserved. This would be to enable a regression analysis to be considered later to determine whether there exists any predictive association between dyslexia-ness and academic confidence. The scatterplot below presents the ordered-pair graphical output of ABC plotted against Dx which is discussed more fully in the Analysis & Discussion section but is shown here for illustrative purposes.
The focus of the data analysis in this enquiry has been to determine whether there exists significant differences in mean values of the dependent variable across the research subgroups. It is recognized that the application of ANOVA to this data may have been appropriate although this process is recommended to be used when the independent variable is categorical in nature (Lund & Lund, 2016). ANOVA could be used, for example, to determine whether exam performance differed based on test anxiety levels amongst students where in this case, exam performance would be the dependent variable most typically measured on a continuous, possibly percentage scale, but where student text anxiety may perhaps be categorized as either 'low-stressed', 'moderately-stressed' or 'highly-stressed' (ibid). In this case it can be seen that anxiety level would not have been measured in a way that assigned a specific score value of anxiety to each respondent in the study sample, merely that respondents would have been collated into categorical groups where no comparison between anxiety levels would be attempted within groups. Thus the ANOVA in this case would test the (null) hypothesis that the (population) means of exam performance (of the groups) are all equal. In this current study, had dyslexia-ness been categorized into 'high', 'moderate' or 'low', it can be seen that ANOVA may have been an appropriate statistical test to use (Moore & McCabe, 1999). However, it was felt that the relatively simpler Student's T-test would be a better choice for determining whether there exists significant differences in (population) mean values of Academic Behavioural Confidence where the continuously-valued Dyslexia Index is used as the independent variable. In this way, a matrix of t-test outcomes could be constructed which would identify significant differences not only between levels of ABC for the three research subgroups, but also at a factorial level both of Academic Behavioural Confidence and of Dyslexia Index following a principal component analysis of both of these variables. This analysis decision was further supported by consulting the Statistical Test Selector offered through Laerd Statistics (op cit) where describing this study design as one looking for between-subjects group differences with one independent, continuous variable and one dependent, continuous variable indicated that the Independent Samples t-test would be appropriate. It is recognized that the t-statistic used in the t-test forms the basis of ANOVA in any case where the required F-statistic in ANOVA is exactly equal to t2. It is possible that this analysis decision may be reconsidered perhaps as a recommended project development given that despite the Laerd Statistics recommendation to use the t-test, by redefining Dyslexia Index as a categorical variable and establishing clear, categorical boundaries containing ranges of dyslexia-ness that could be assigned such categories as 'low', 'low-to-moderate' ... etc, an ANOVA would be an appropriate statistical analysis to perform.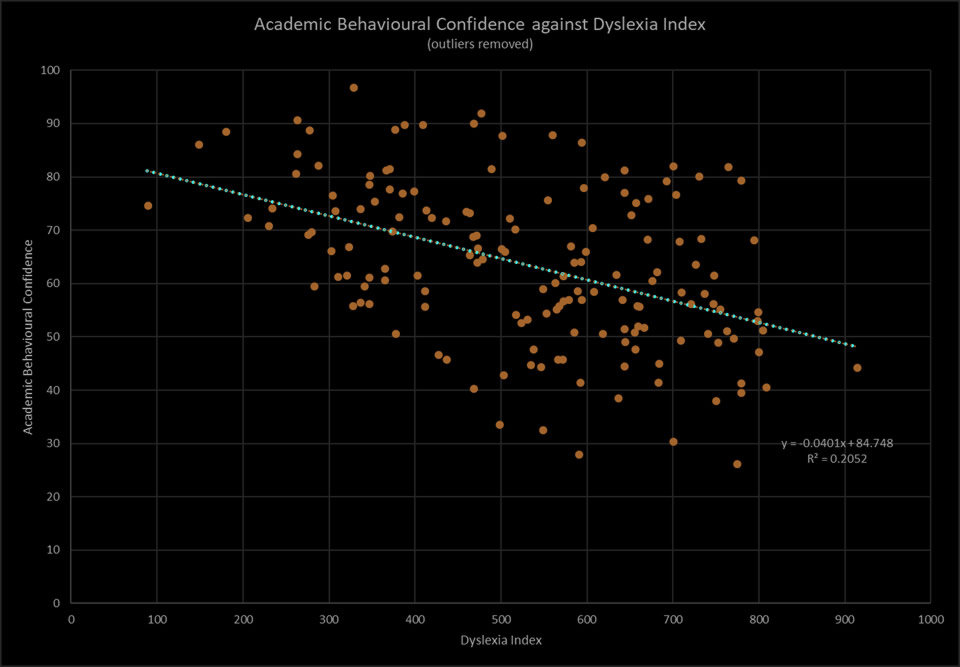
- Effect size
Effect size challenges the traditional convention that the p-value is the most important data analysis outcome response to determine whether an observed effect is real or can be attributed to chance events (Maher et al, 2013). Effect size values are a measure of either the magnitude of associations or the magnitude of differences, depending on the nature of the data sets being analysed. For associations, the most frequently used measures to determine the strength (magnitude = 'size') of association are correlation or regression coefficients so these are effect size measures (ibid). Conversely, the p-value is an indication of statistical significance, that is, the probability of whether an outcome has naturally occurred as a result of chance or is otherwise indicating that the event has been caused by something, that is there has been an 'effect' and the outcome observed has not occurred randomly by chance. Statistical tests that generate this measure of significance are widely used and although any level of significance could be used as the determining cut-off point, p=0.05 is conventionally used as the borderline probability level where a value of p < 0.05 leads researchers to conclude that they have a 'significant result' and that therefore this result has NOT occurred by chance and thus represents an outcome that has occured in the top, bottom or combined 5% of the distribution of all outcomes. When a sufficiently large sample size is employed, a test of significance that is used to determine whether there has been an effect or not, that is, an unexpected outcome, will almost certainly 'demonstrate a significant difference, unless there is no effect whatsoever' (Sullivan & Feinn, 2012, p635). For example, in a large sample of say, n=20,000 that is being used to explore the effect of a drug intervention to mediate a medical condition, due to the size of the sample a statistical test will almost invariably determine that there is a significant between-groups difference in the (mean) effect of the drug even though that actual (or absolute) difference between the groups' means is very small due to the nature of the t-test parameter and the interpretation of it. Whereas significance tests are influenced by sample size, effect size is not because it is an absolute measure, usually of this difference between means. Hence where a statistically significant outcome suggests that a relationship may exist between variables, an effect size will provide an indication of the extent of the relationship, that is, its strength (Gilner et al, 2001). Effect size is easy to calculate, indeed the simplest result is the absolute difference between the means of two independent groups' data sets. An improved measure is derived by dividing this result by the standard deviation of either group and in this form, the effect size is referred to as 'd', more usually 'Cohen's 'd'' after the originator of the process (Cohen, 1988). Aside from Cohen's 'd' and correlation coefficients such as Pearson's r, there are various other measures for effect size (Thalheimer 2002 provides a summary), however Cohen's d is commonly used. The distinct magnitudes of effect size measures were suggested by Cohen as d=0.2 (small), d=0.5 (medium) d=0.8 (large) and d=1.3 (very large) (op cit) and although these labels do not appear to account for the impact that other factors may have on the variables such as the accuracy of the data gathering tool or the diversity of the study's background population, it appears that these labels or designations are widely used and hence their meanings are commonly understood. Effect size is useful as a measure of the between-groups difference between means, particularly when measurements have no intrinsic meaning, as is often the case with data generated from Likert-style scales (Sullivan & Feinn, 2012, p279). It must be added however, that the data distributions of each of the groups is expected to be normal although this is almost always the fundamental assumption about the nature of the background population from which a sample is drawn, not the least as a consequence of the Central Limit Theorem. Tests to establish the safeness of making this assumption are varied, but commonly the Shapiro-Wilk test for normality is widely used (Lund & Lund, 2016). Effect size is an indication of the extent of overlap between the distributions where an effect size of 0 (zero) would indicate that there is no difference between the means of the groups and that one (standardized) normal distribution would completely eclipse the other. Conversely, an effect size of, for example, 0.7 would generate an overlap between the two standardized normal distributions of approximately 73% where the two distributions represents the control group and the test group respectively.
Hence at an early stage of planning the data analysis process, generating effect size measures were chosen to be the main data analysis outcomes. However rather than calculate Cohen's d effect size differences between the mean values of Academic Behavioural Confidence for the three research subgroups, the alternative effect size measure of Hedges' g was used because this measure takes better account of the sample sizes of the relative distributions by using a 'pooled' (that is, a weighted) standard deviation in the effect size calculation. This is especially appropriate when the sample sizes are notably different, which is the case in this project.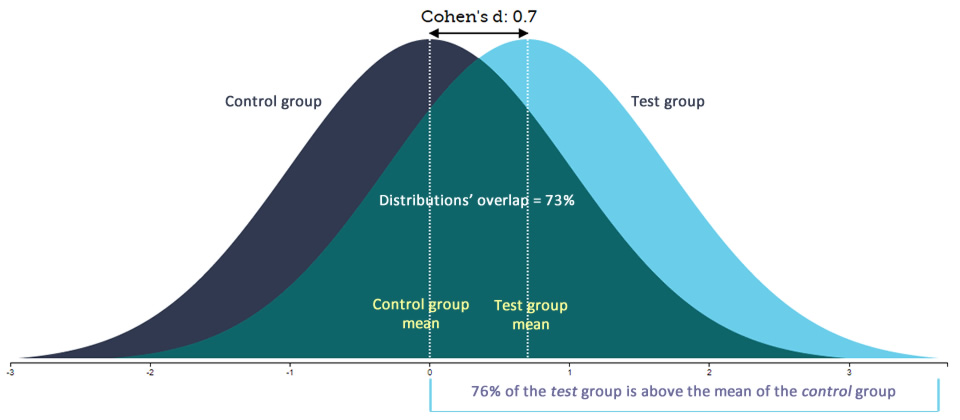
(adapted from Magnusson, 2014)
- Principal Component Analysis
The process of Principal Component Analysis (PCA) performs dimensionality reduction on a set of data, and especially a scale that is attempting to evaluate a construct. The point of this process is to see if a multi-item scale can be reduced into a simple structure with fewer components (Kline, 1994). As a useful precedent, Sander & Sanders (2003) recognized that dimension reduction may be appropriate and had conducted a factor analysis of their original, 24-item Academic Behavioural Confidence (ABC) Scale which generated a 6-factor structure, the components of which were designated as Grades, Studying, Verbalizing, Attendance, Understanding, and Requesting. Their later analysis of the factor structure found that it could be reduced into a 17-item scale with 4 factors, which were designated as Grades, Verbalizing, Studying and Attendance (Sander & Sanders, 2009). As reported in the Results, Analysis & Discussion section, given that the reduced, 17-item ABC Scale merely discounts 7 dimension from the original 24-item scale which is otherwise unamended, in this project it was considered appropriate to deploy the full, 24-item scale to generate an overall mean ABC value in the analysis so that an alternative 17-item overall mean ABC value could also be calculated to examine how this may impact on the analysis outcomes. But much like the well-used Cronbach's 'alpha' measure of internal consistency reliability, factor analysis is ascribable to the dataset onto which it is applied and hence, the factor analysis that Sander & Sanders (ibid) used and which generated their reduced item scale with four factors was derived from analysis of the collated datasets they had available from previous work with ABC, sizeable though this became (n=865). It was considered therefore that the factor structure that their analysis suggested may not necessarily be entirely applicable more generally and without modification or local analysis, despite being widely used by other researchers in one form (ABC24-6) or the other (ABC17-4) (eg: de la Fuente et al, 2013, de la Fuente et al, 2014, Hilale & Alexander, 2009, Ochoa et al, 2012, Willis, 2010, Keinhuis et al, 2011, Lynch & Webber, 2011, Shaukat & Bashir, 2016). Indeed, Stankov et al (in Boyle et al, 2015) in reviewing the Academic Behavioural Confidence Scale implied that more work should be done on consolidating some aspects of the ABC Scale, not so much by levelling criticism at its construction or theoretical underpinnings but more so to suggest that as a relatively new measure (> 2003) it would benefit from wider applications in the field and subsequent scrutiny about how it is built and what it is attempting to measure. Hence conducting a factor analysis of the data collected in this project using the original 24-item ABC Scale is worthwhile because it may reveal an alternative factor structure that fits the context of this enquiry more appropriately. Indeed, this process has been completed as part of the data analysis which, for the data in this enquiry, revealed a 5-factor model and these (local) factors were designated as Study Efficacy, Engagement, Academic Output, Attendance, and Debating. This outcome is consistent with Stankov's recommendation for more work with the ABC Scale as it is clear that the PCA applied to this datapool does indeed suggest a different factor structure to both of those determined by Sander & Sanders. A comparison of outcomes generated using the ABC24 6-factor model, the ABC17 4-factor model and this ABC24 5-factor model is provided in the Results, Analysis and Discussion section.
![]()
Research Design section summary
This section
![]()
| THESIS | INTRODUCTION > | < THESIS | THEORETICAL PERSPECTIVES > | < THESIS | RESEARCH DESIGN > | < THESIS | ANALYSIS & DISCUSSION > | < THESIS | CLOSING REFLECTIONS |
| +44 (0)79 26 17 20 26 | www.ad1281.uk | ad1281@live.mdx.ac.uk | This page last edited: February 2018 |